Using Gantt Chart
Creating a New Gantt Chart
Basic Gantt Chart
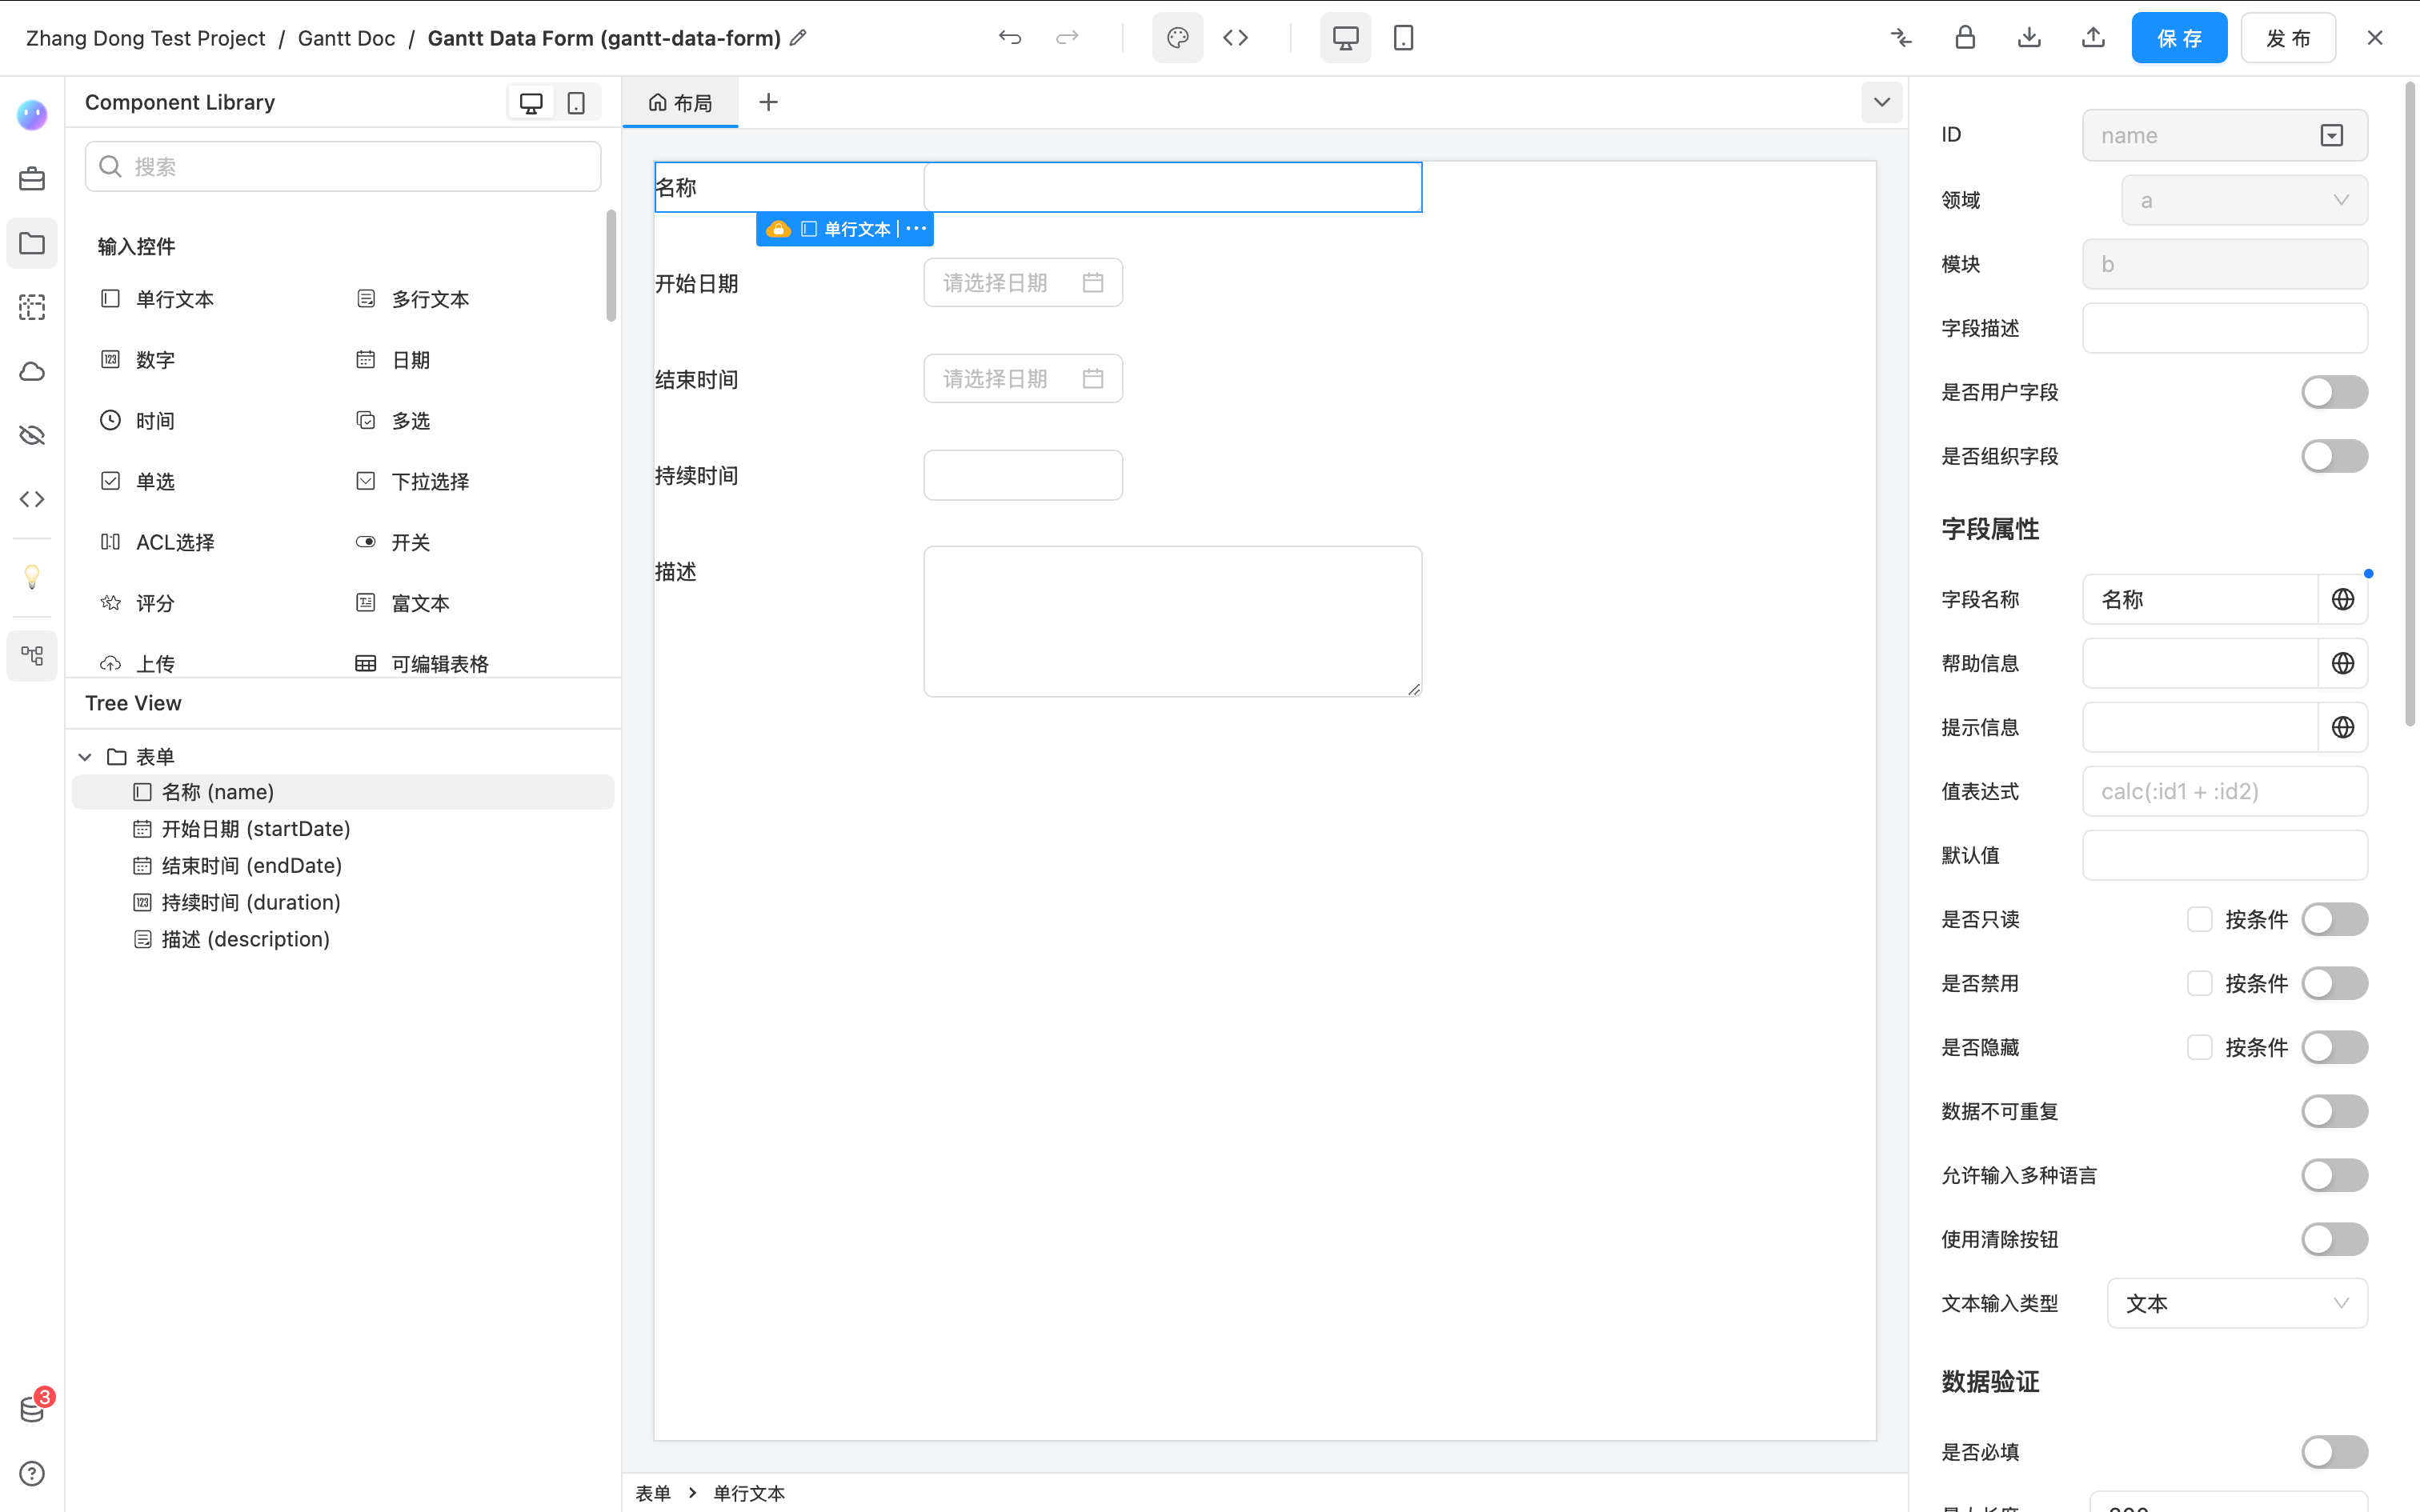
- Create a form as the data source for the Gantt Chart. The data source must include the following fields. The field IDs are not required, and you can name them according to your project needs:
- A single-line text field for the display name (using a single-line text component);
- A start date (using a date component);
- An end date (using a date component) and duration (using a number component).
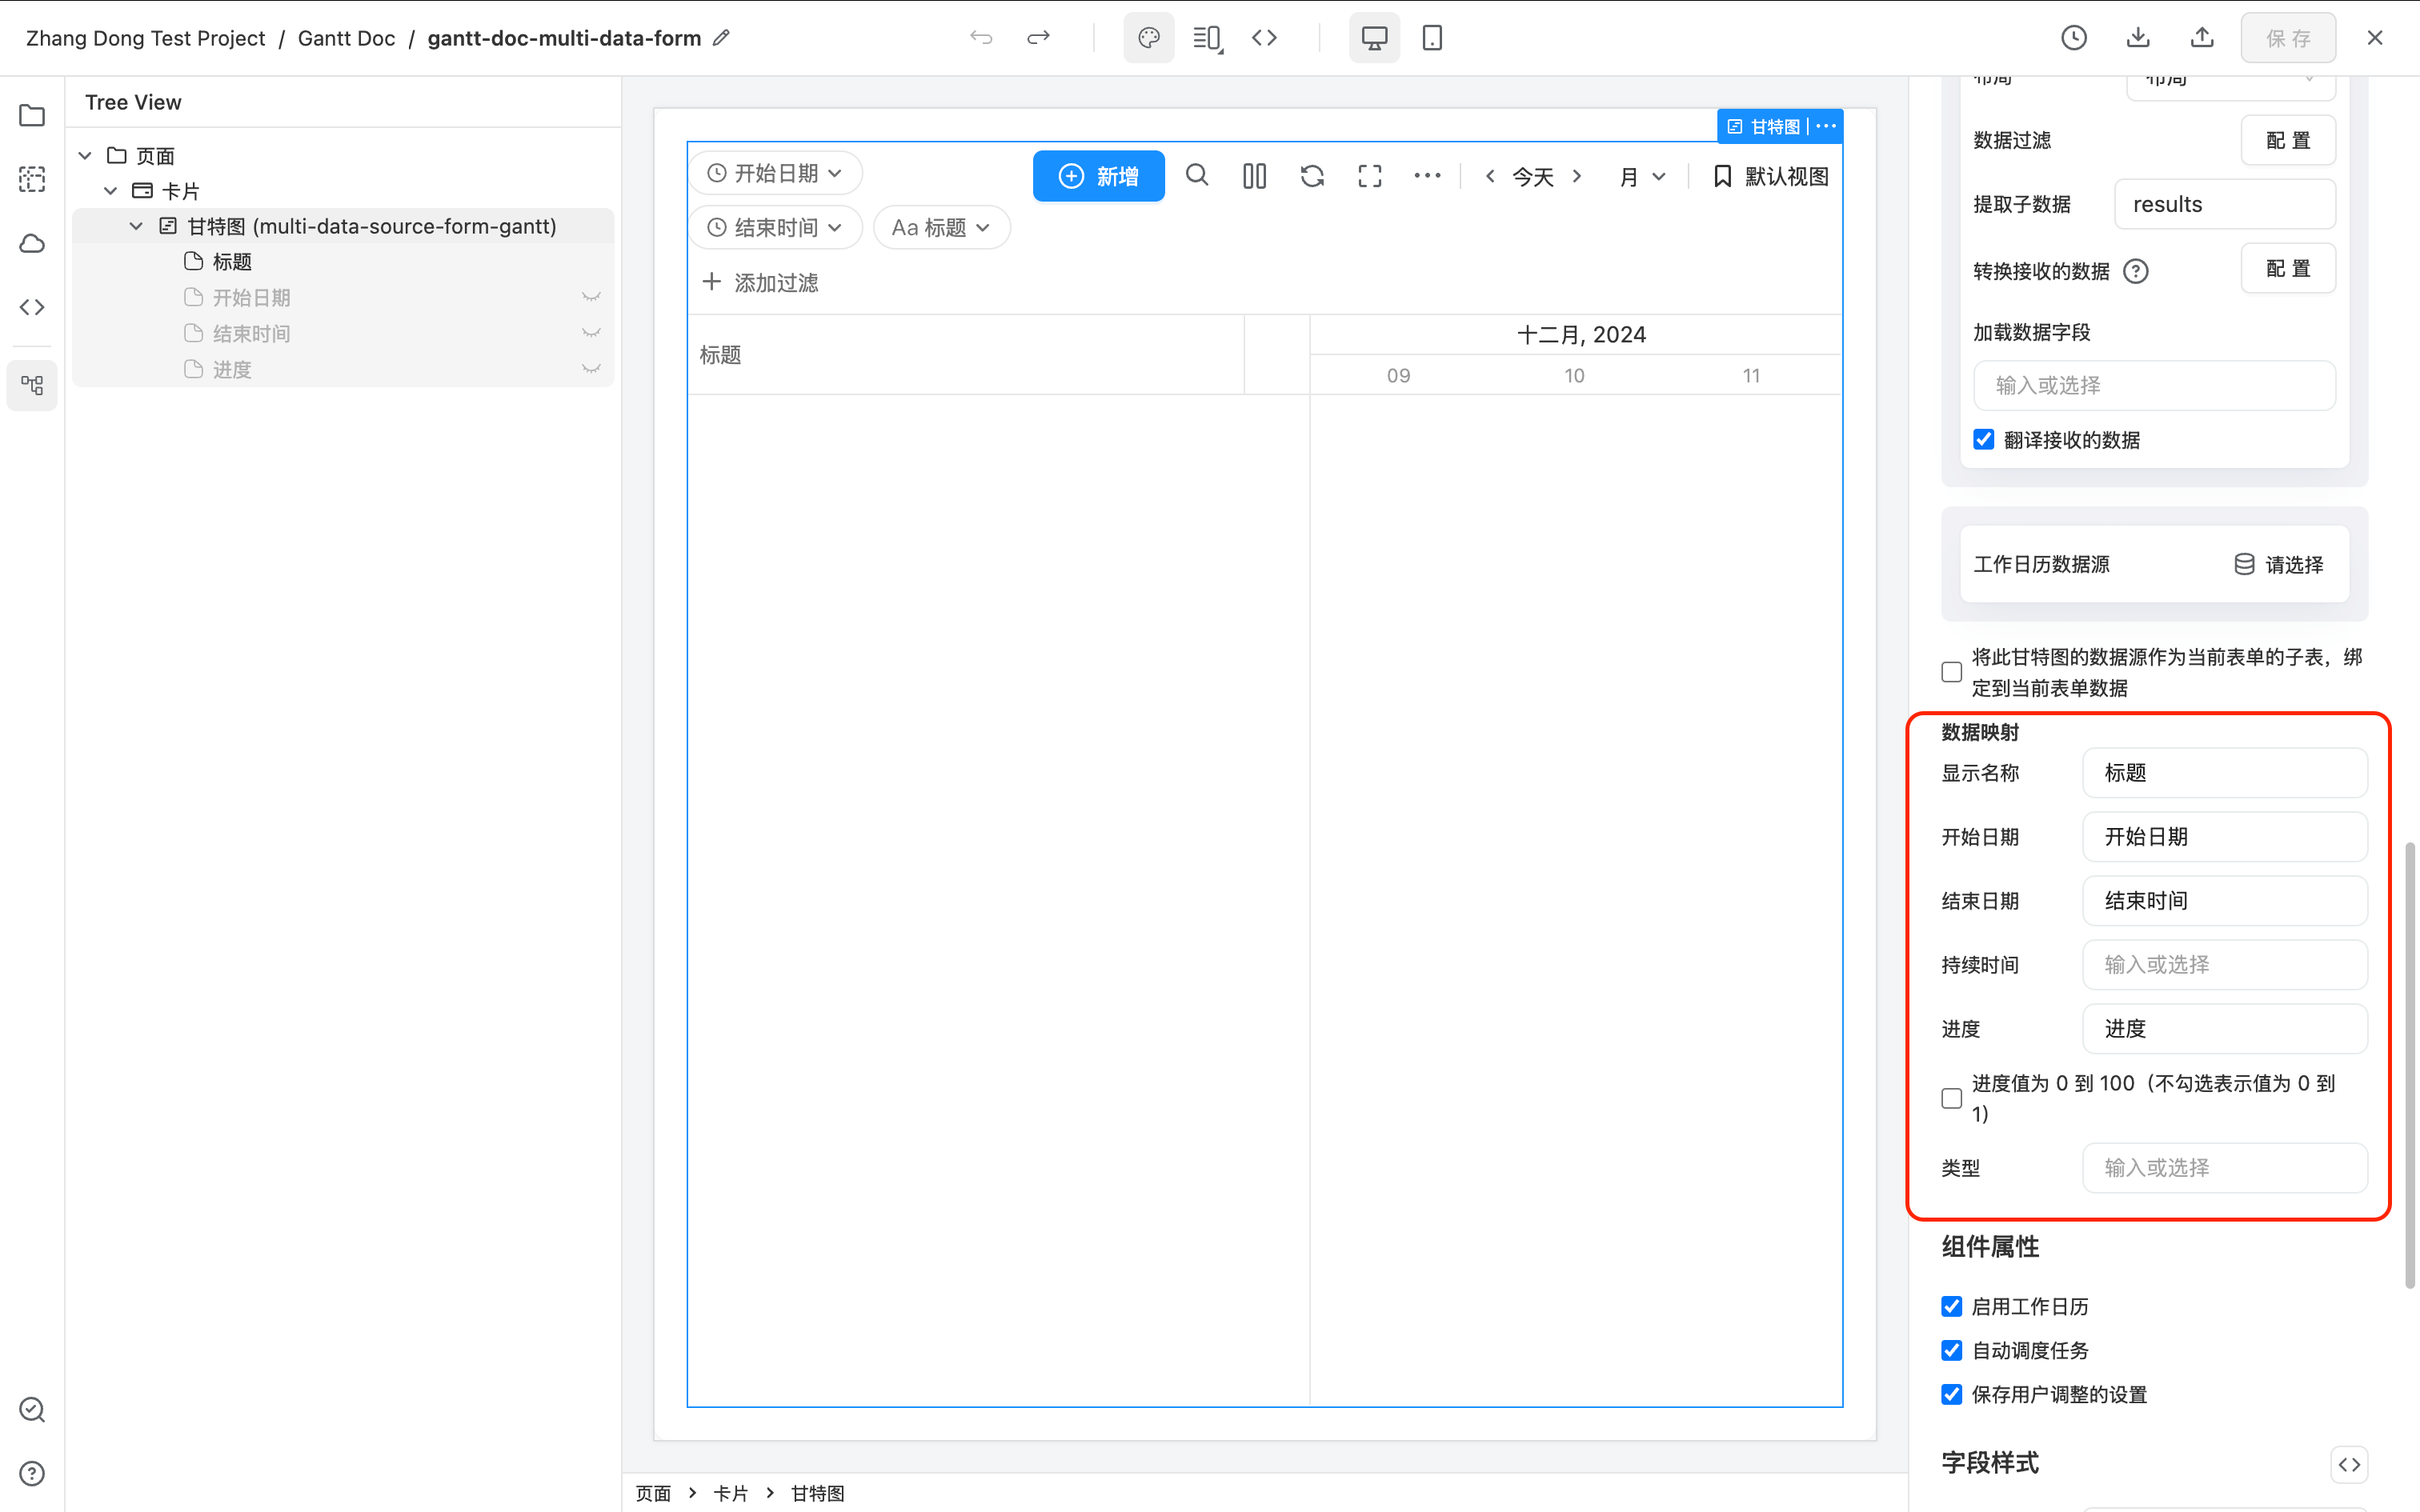
- Create a new page and drag the Gantt component from the component list to the page. In the "Data Source" settings, select the form created in step 1. The "Data Mapping" will automatically recognize and fill in the fields from the form. If it does not recognize them, you need to manually select the fields for "Display Name," "Start Date," "End Date," and "Duration."
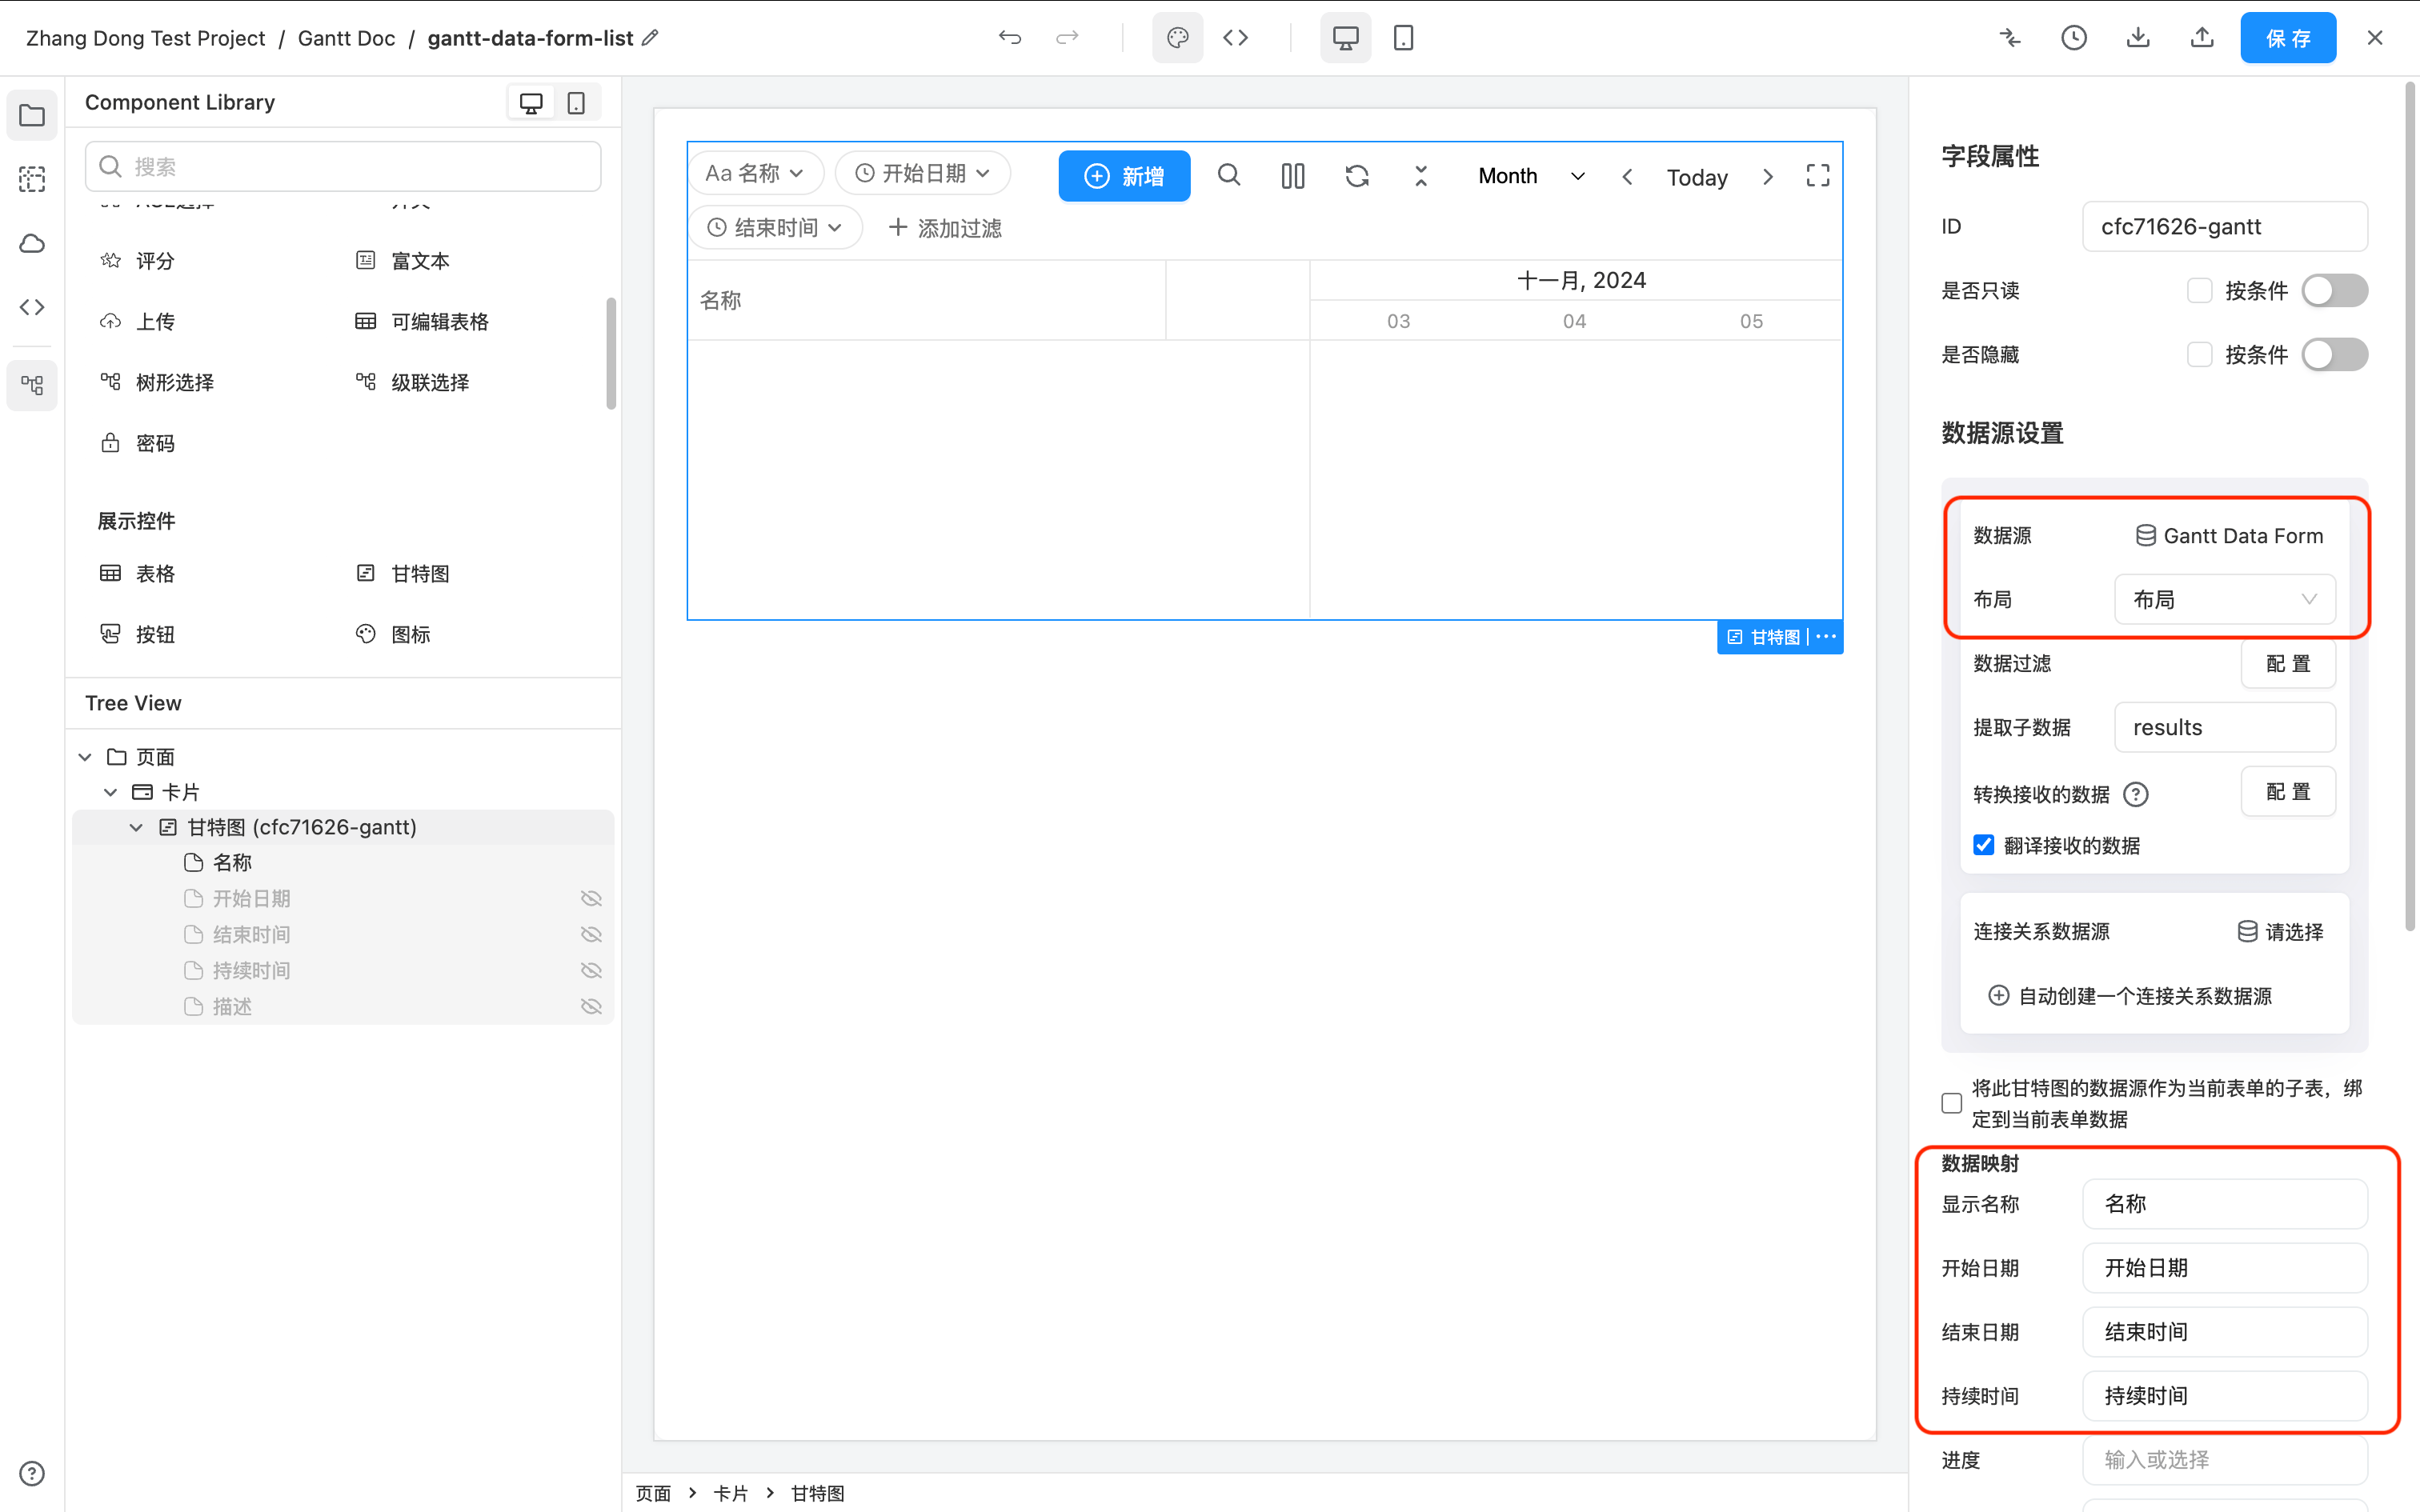
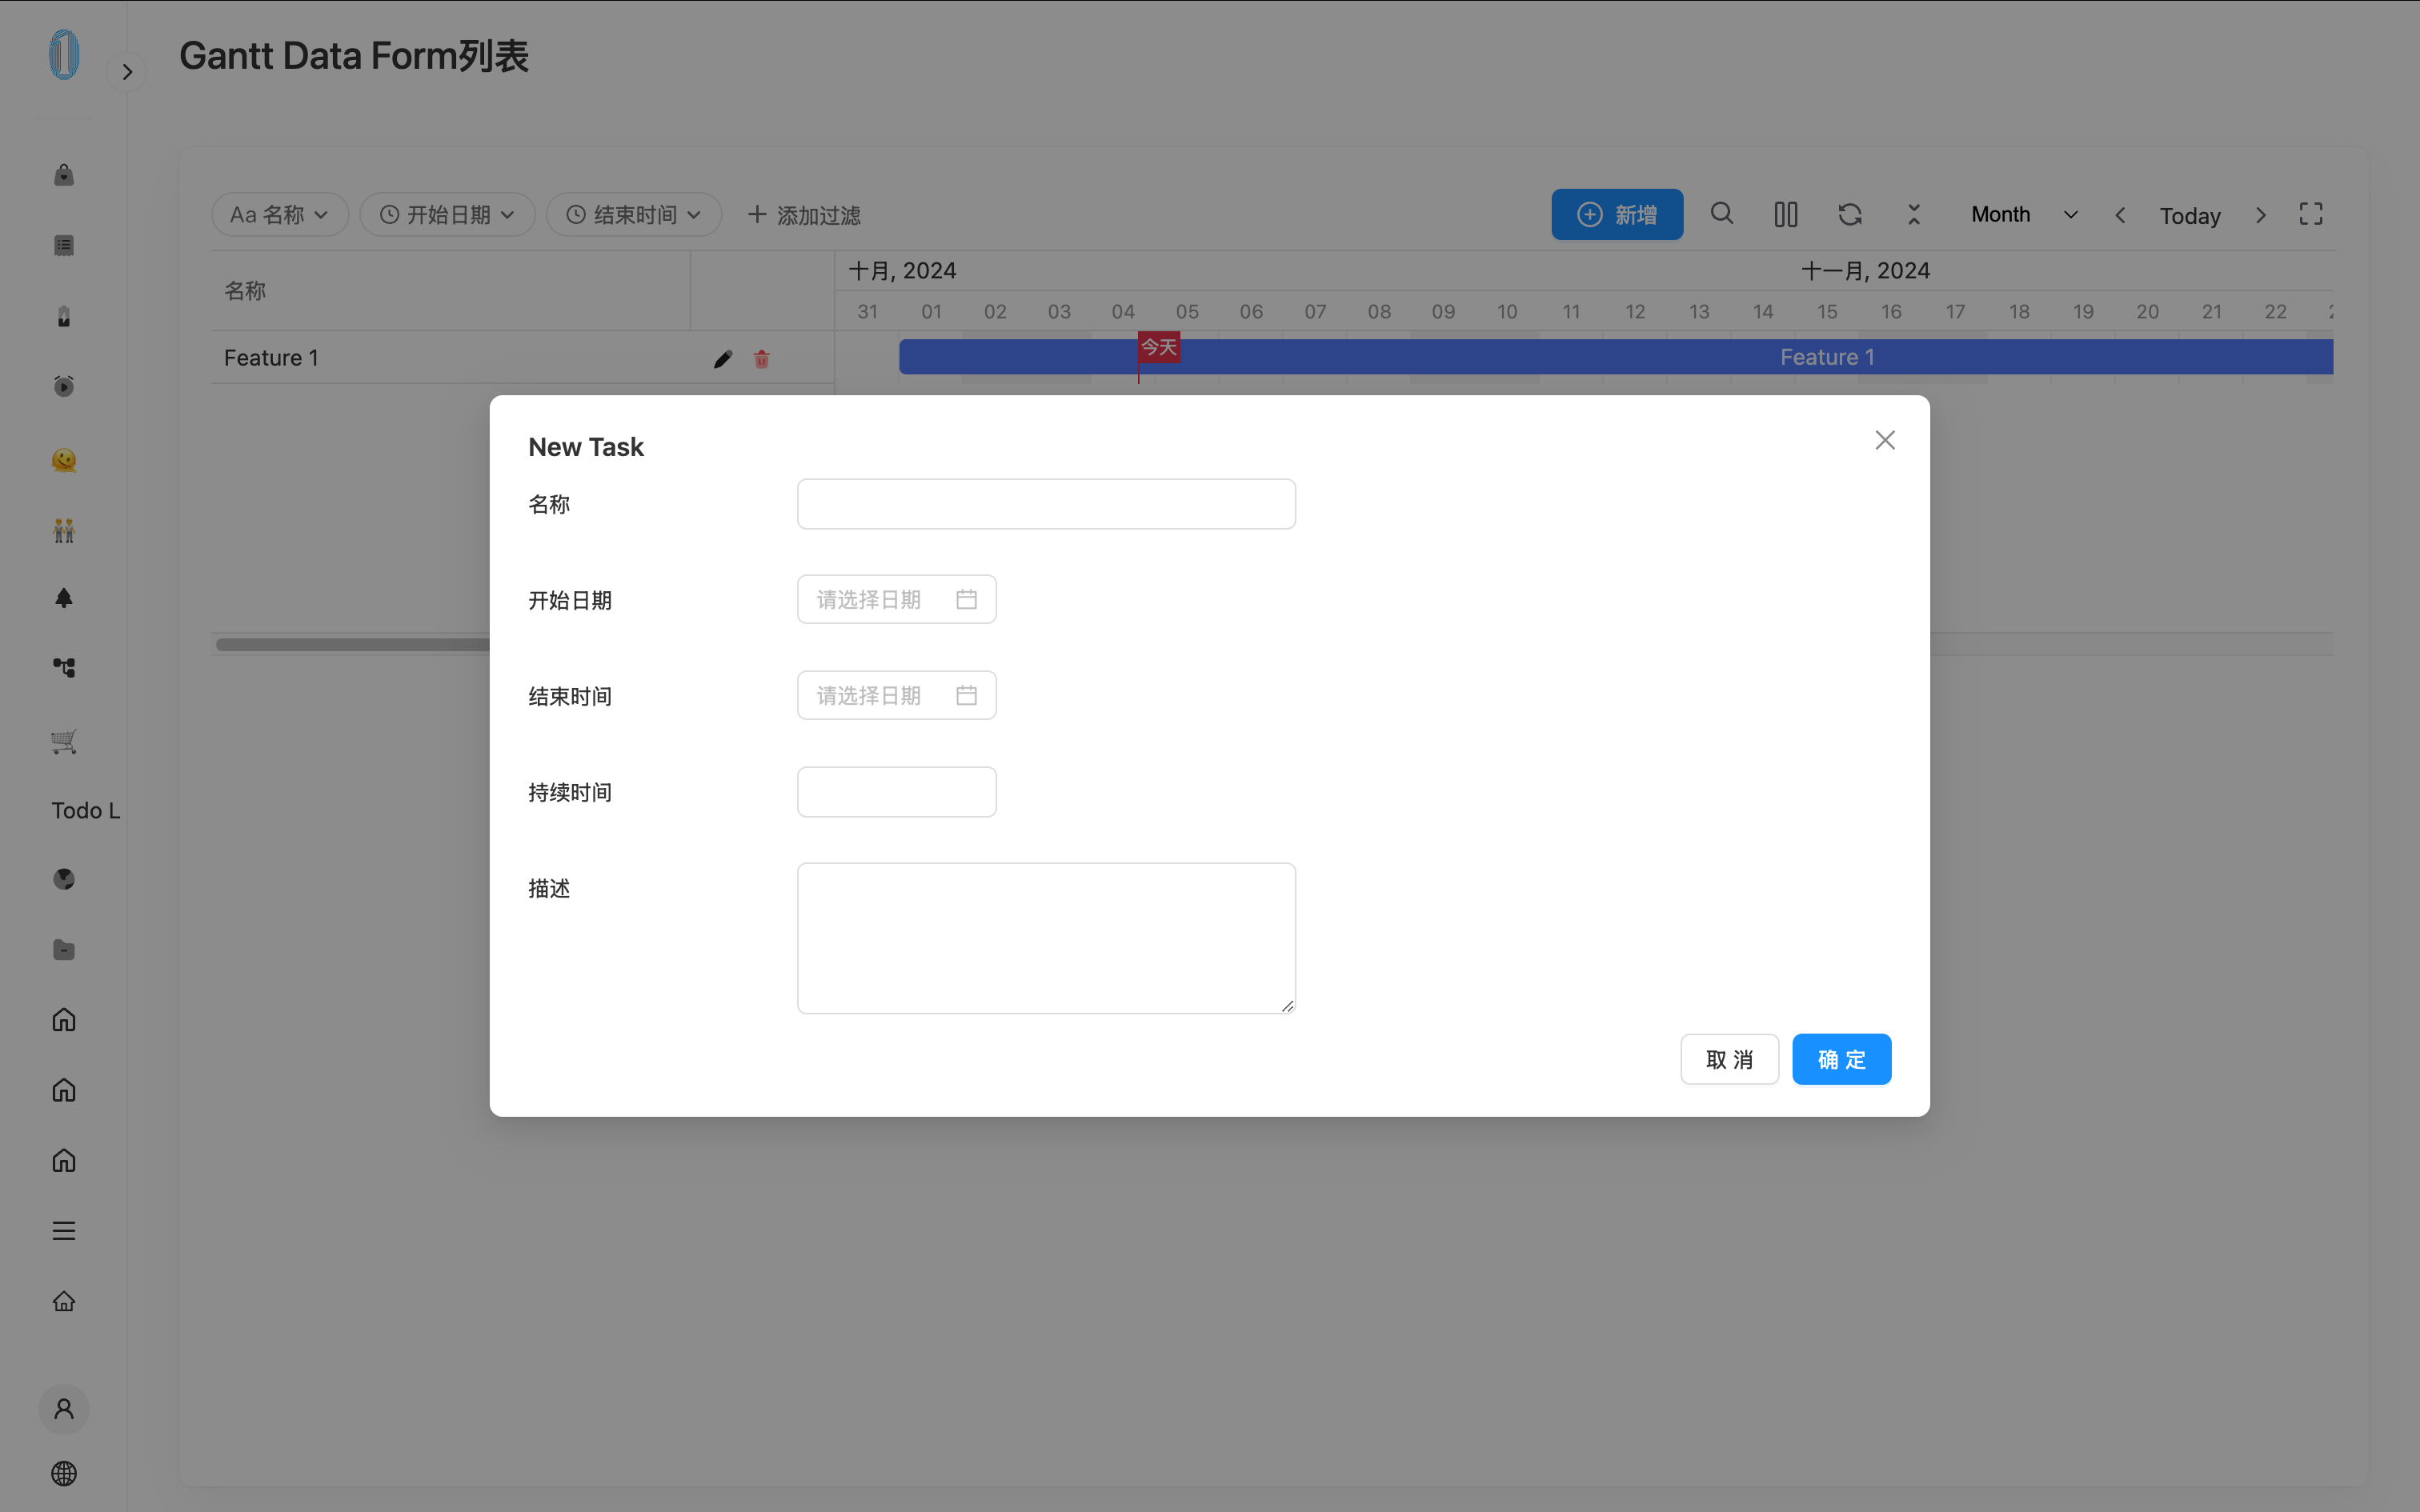
- Add the page to the project menu and visit the page. At this point, the Gantt Chart is already functional for adding, editing, and deleting data. A basic Gantt Chart with these functionalities is now complete.
Supporting Connections
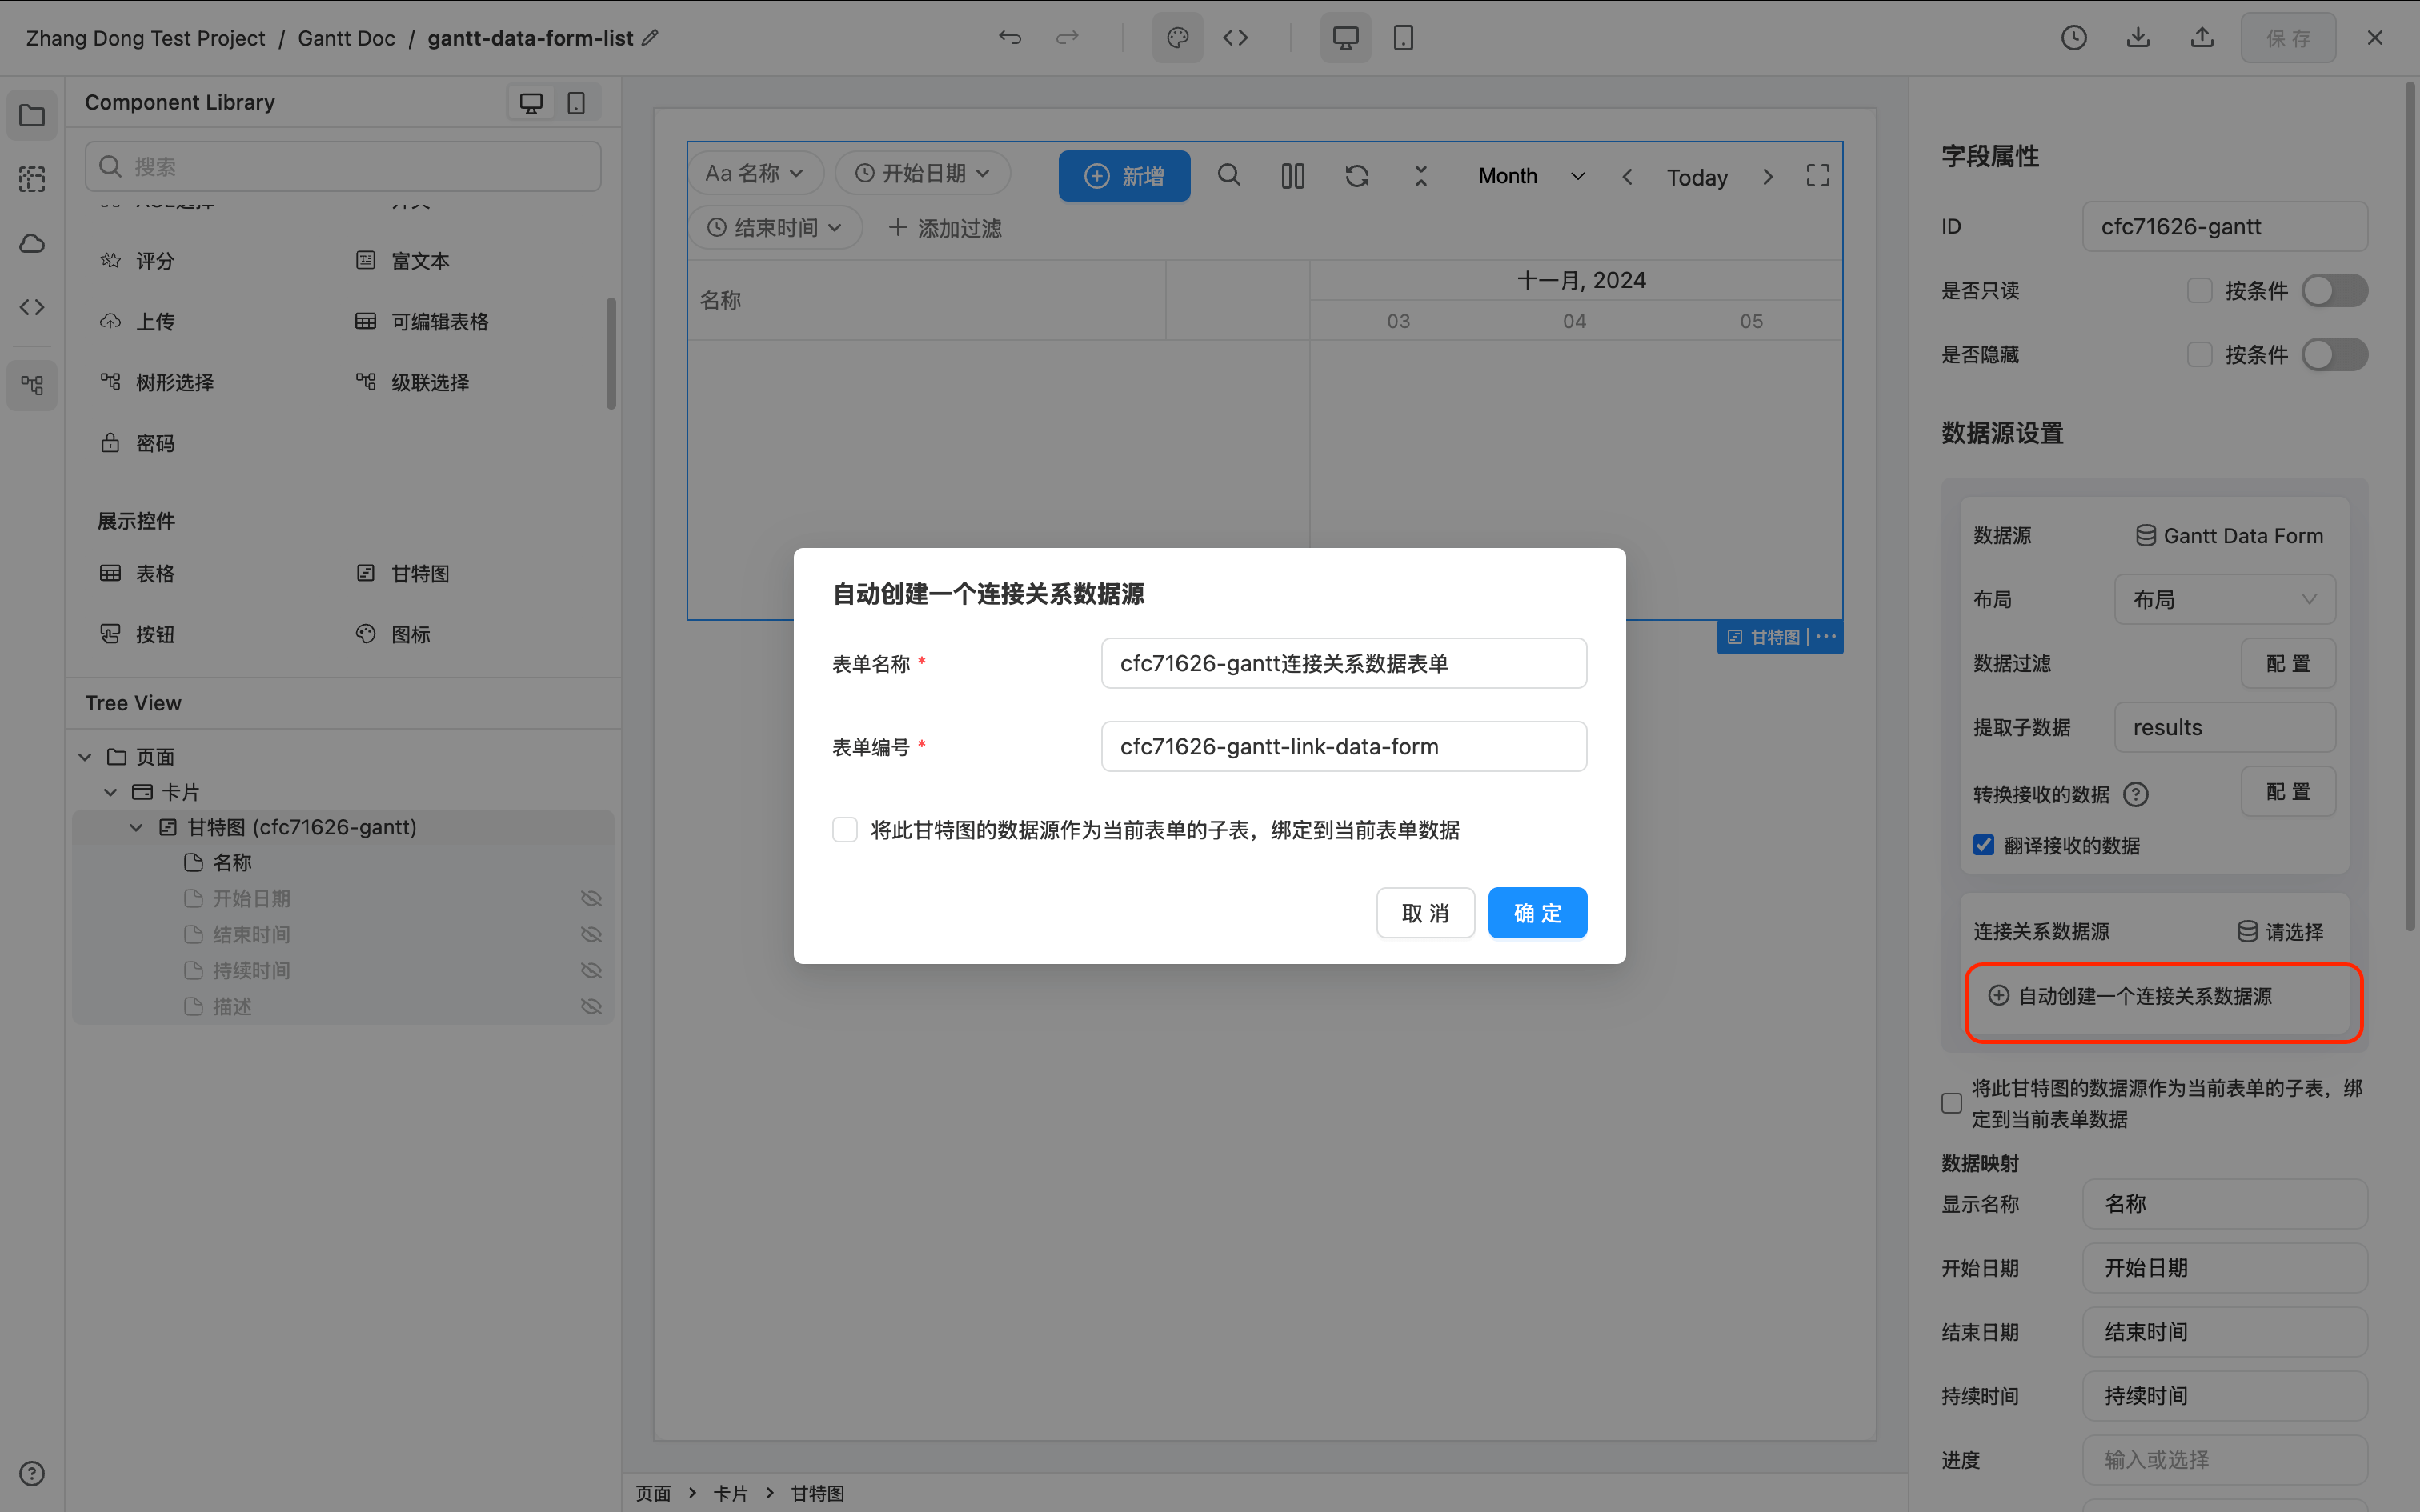
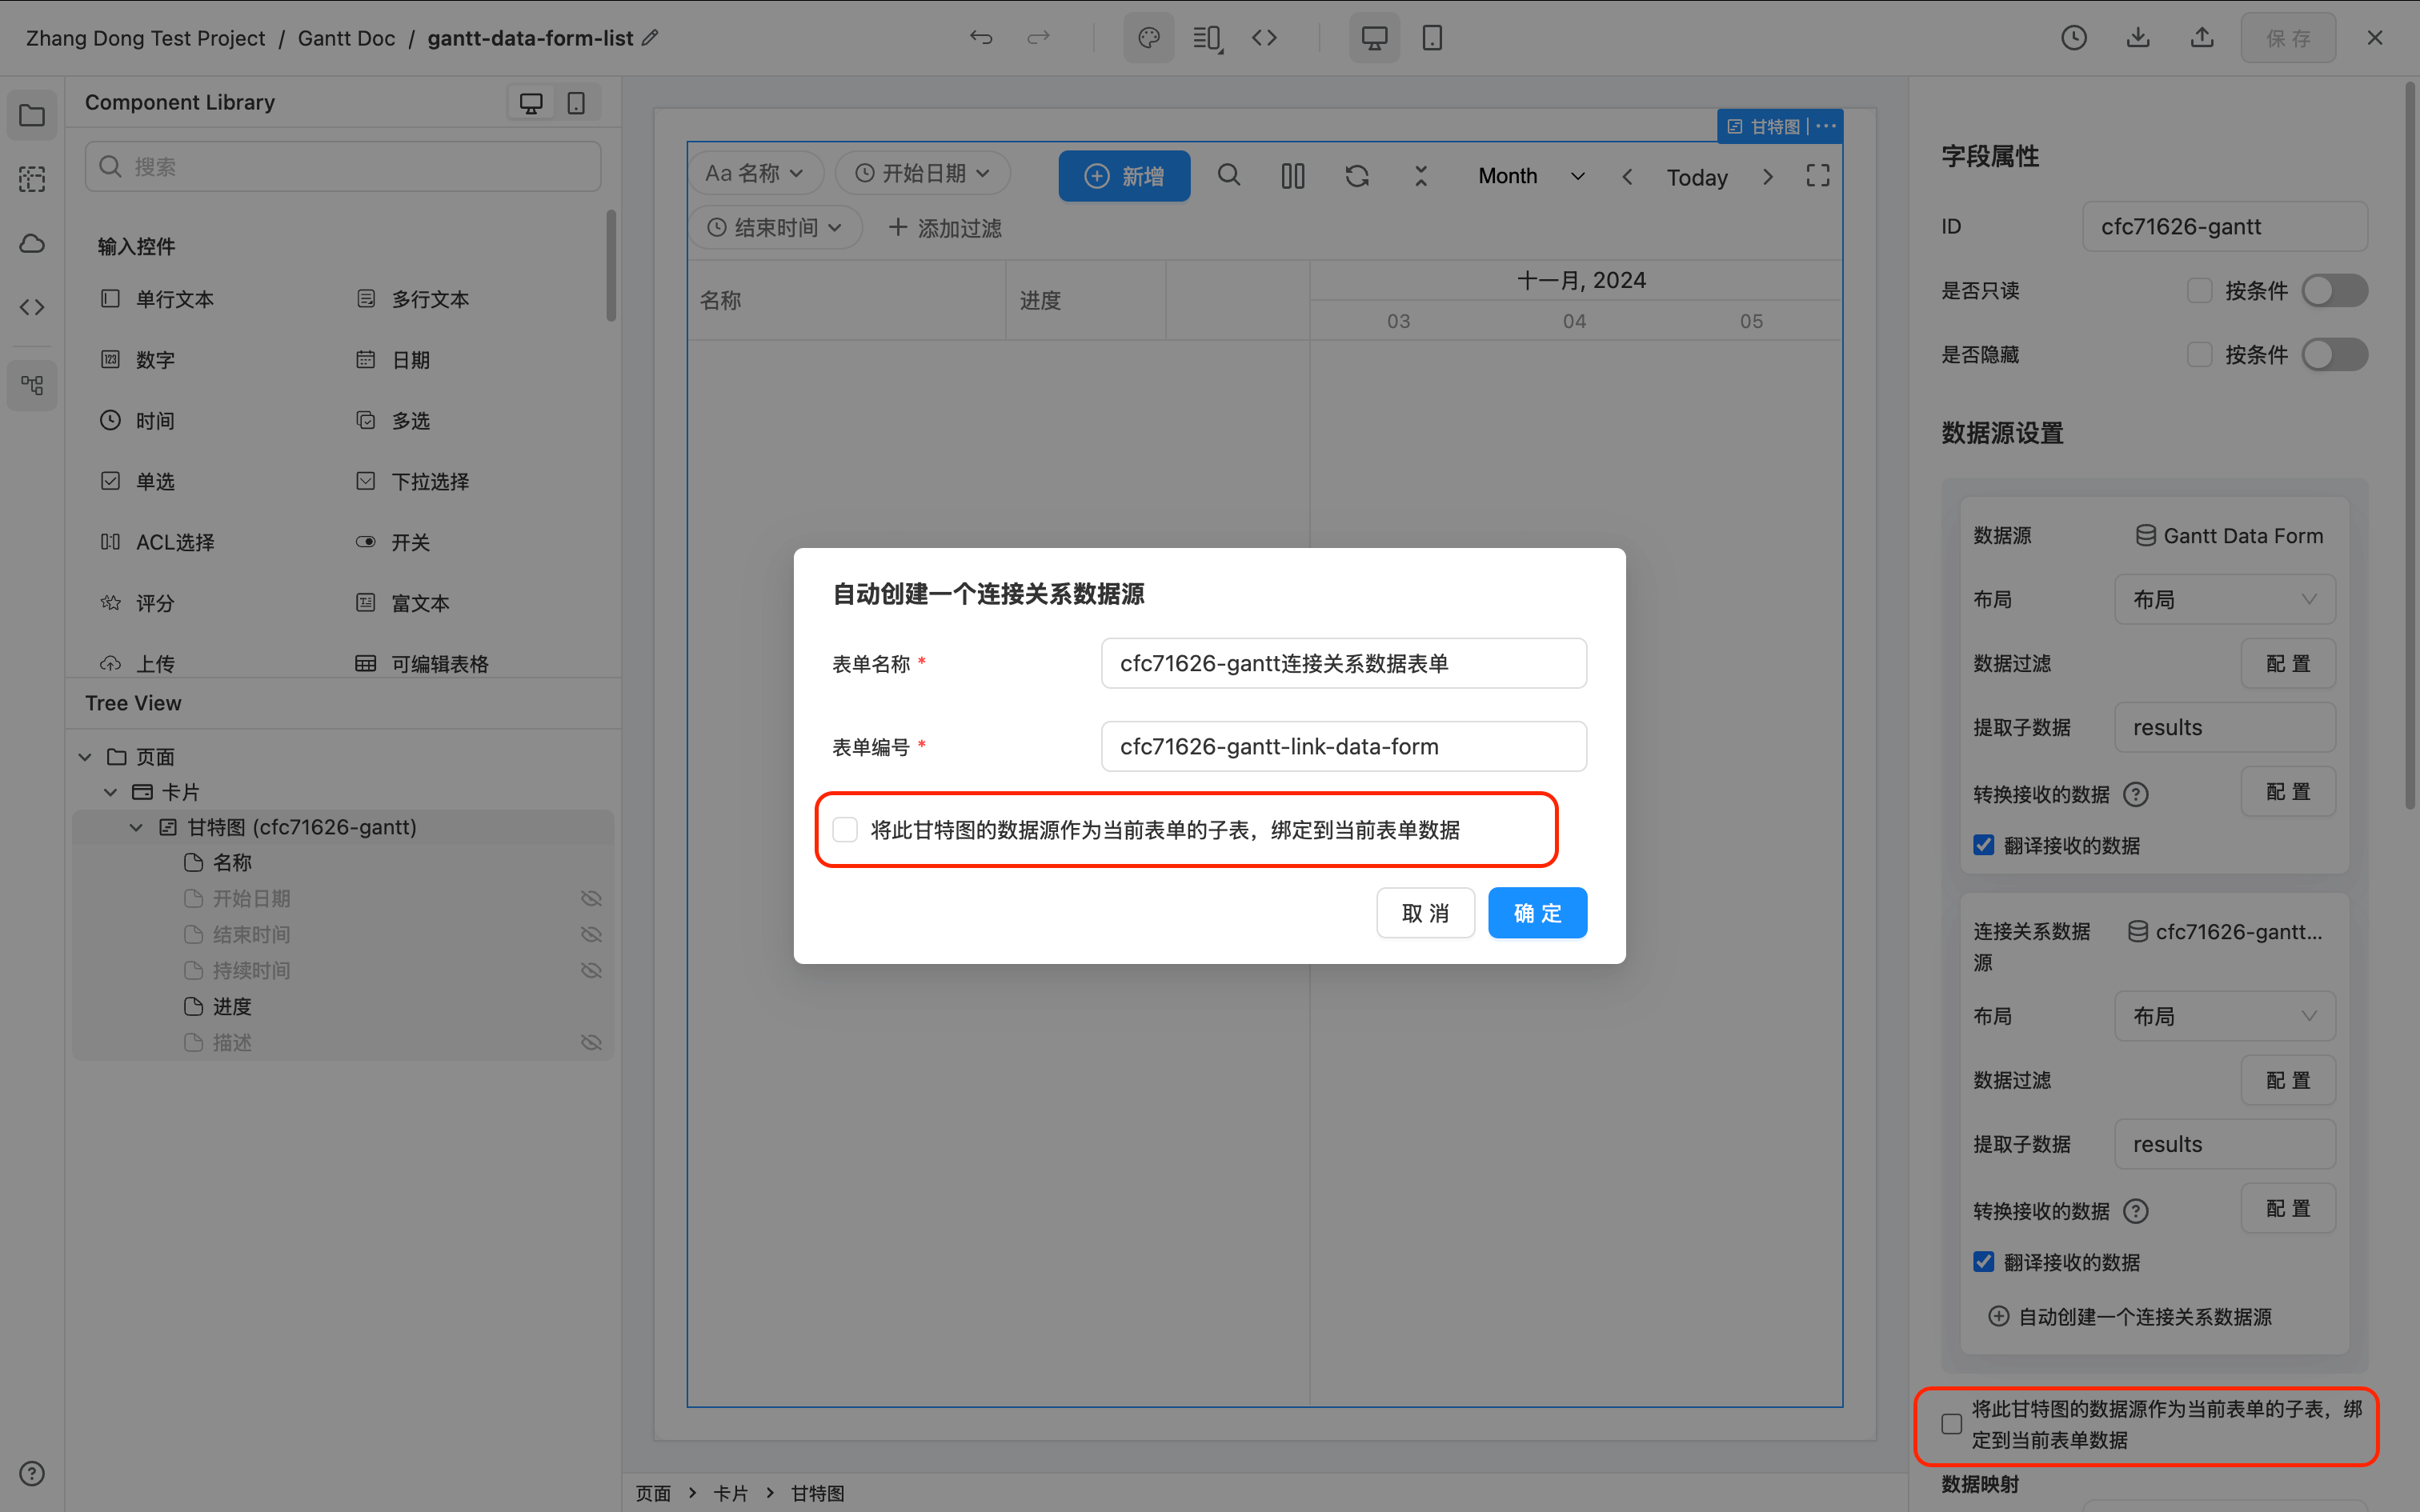
Since the "Connection Data Source" configuration is fixed and there is no need to display it, it is only used to store the connection relationships of the Gantt Chart. You can click the "Automatically generate a form as its data source" option in the data source configuration.
To support connections in the Gantt Chart, a "Connection Data Source" is required. This data source must have the following three fields, and the field IDs are required to be exactly as follows:
- Source, a single-line text component with the ID
source; - Target, a single-line text component with the ID
target; - Type, a single-line text component with the ID
type.
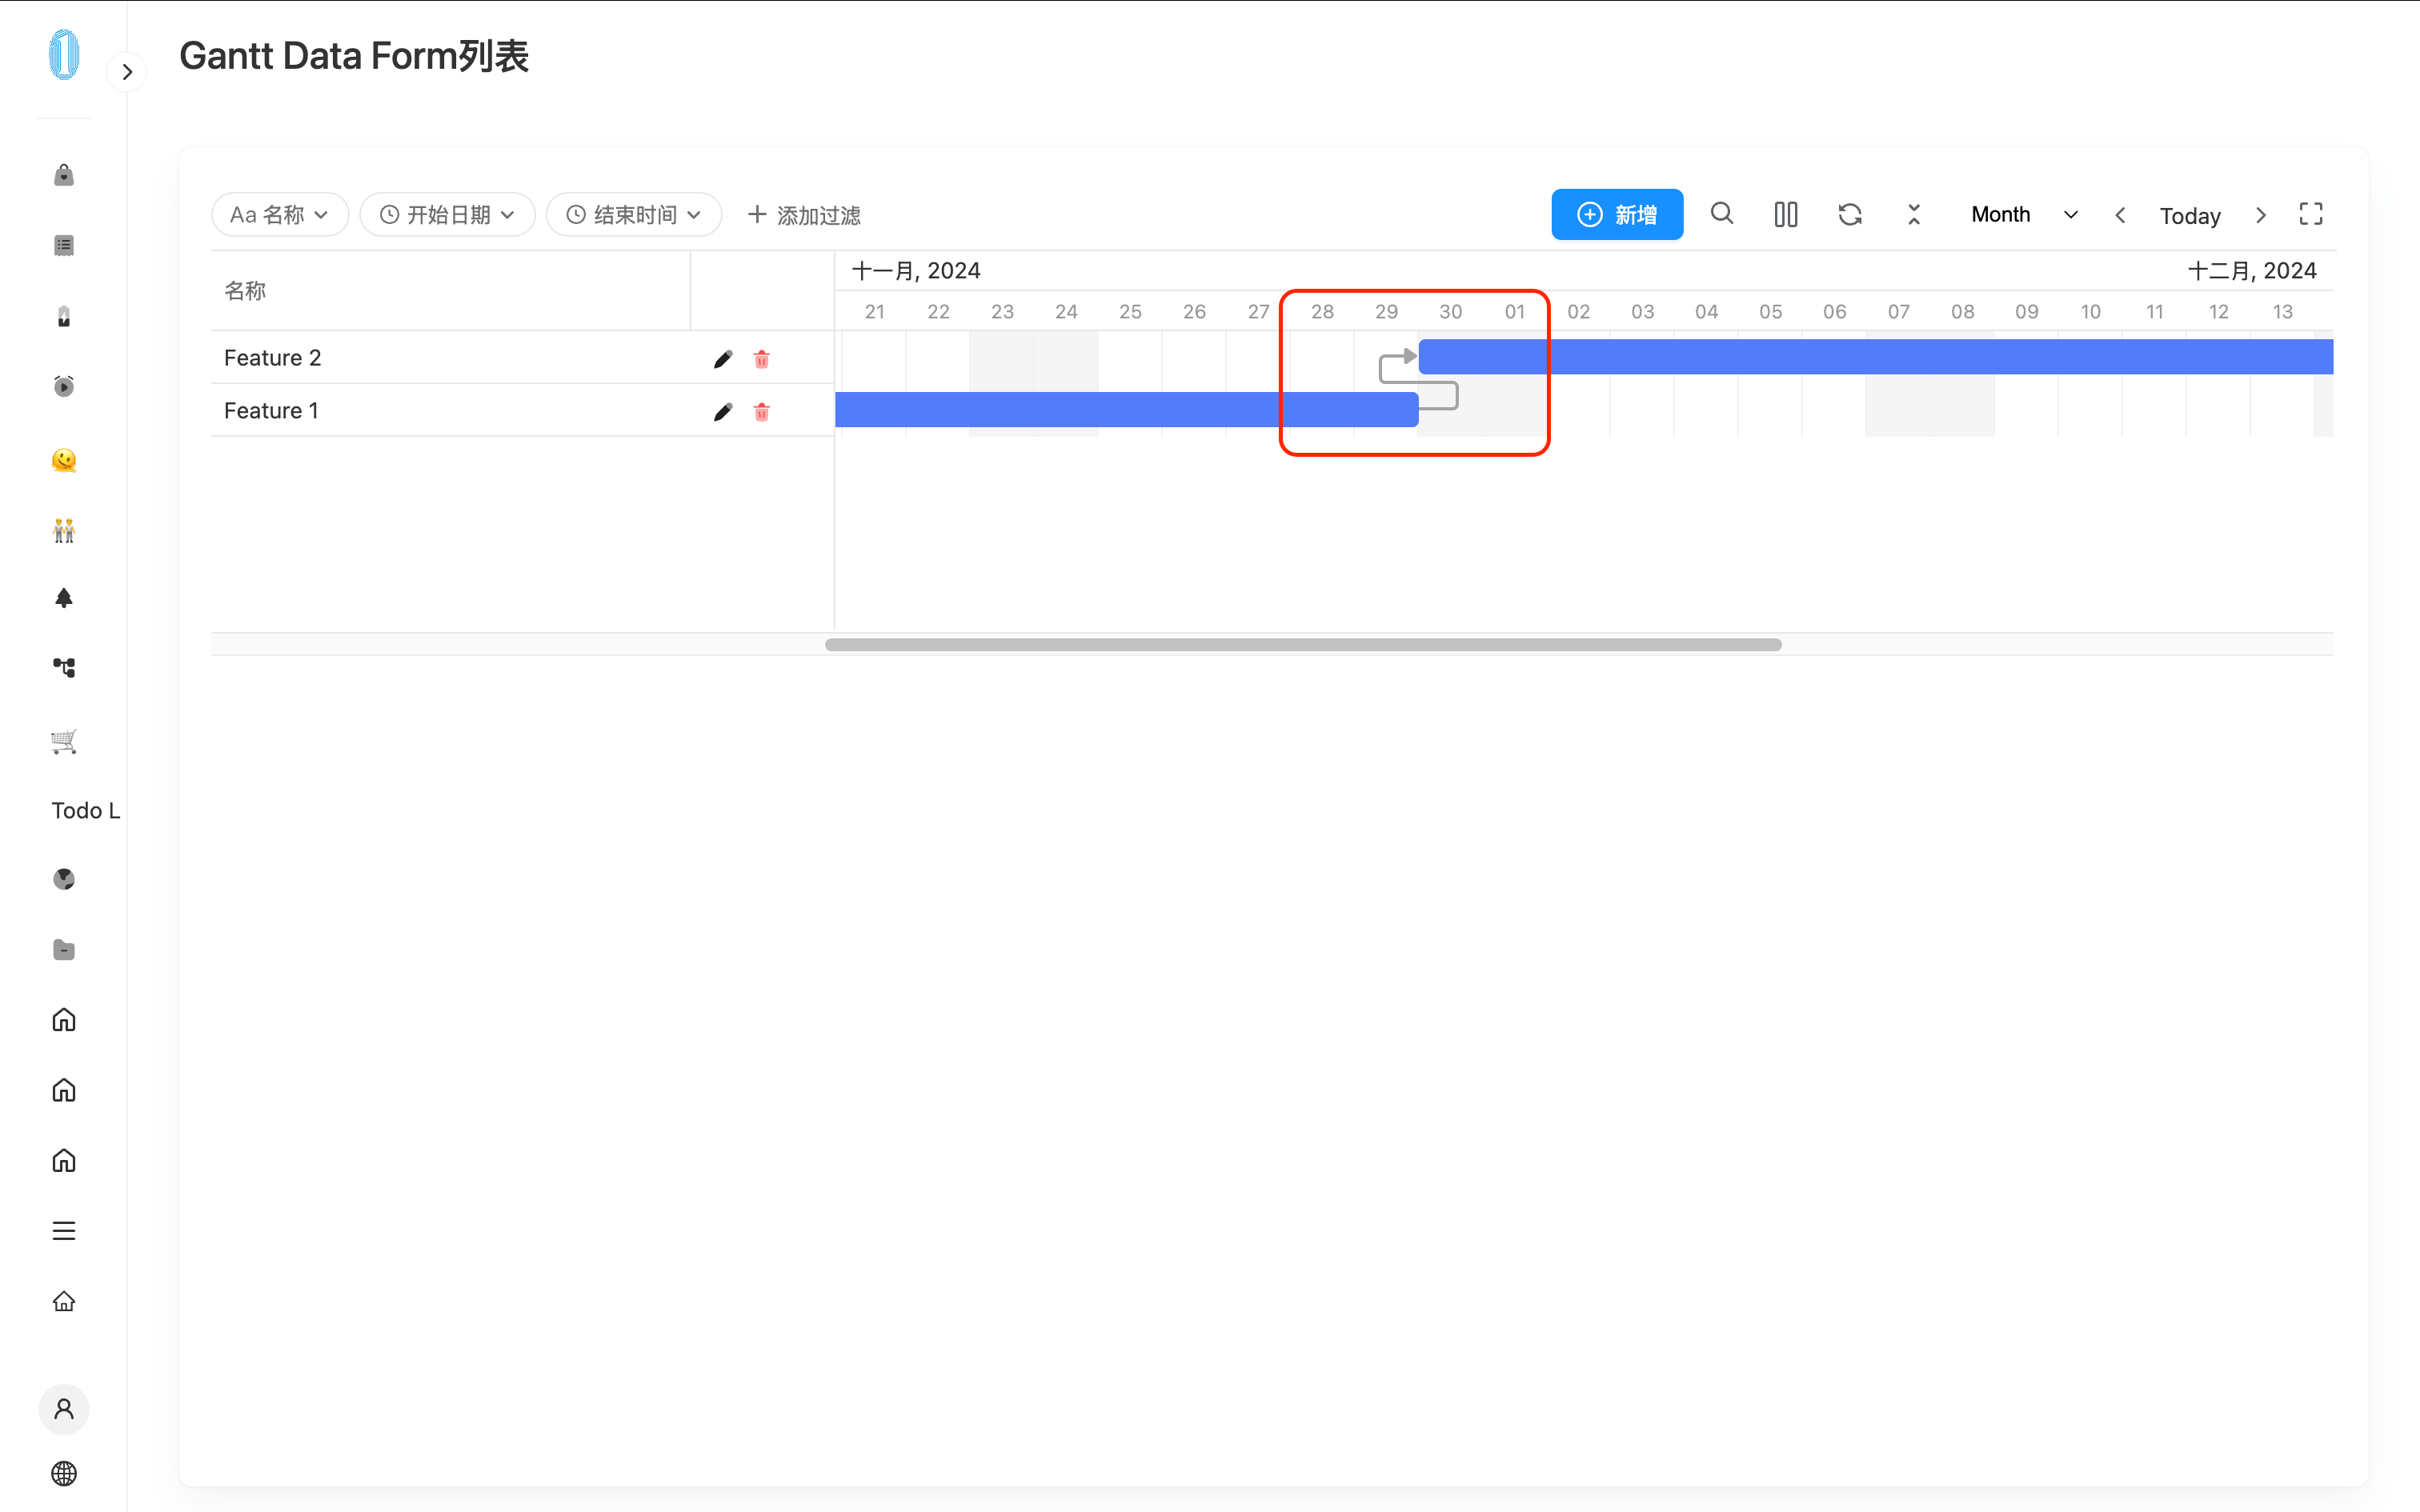
At this point, when you visit the page, you can connect tasks by dragging from the head or tail of two tasks in the Gantt Chart using the mouse.
Supporting Hierarchical Structures
In this example, the entire hierarchical structure of the Gantt Chart is stored in a single form called "Task Data Source." If sub-tasks need to be stored in different forms, refer to the documentation below: Gantt Graph subtask data source uses different forms。
Using a Single-Line Text Input for Hierarchical Relationships
When you do not want to see the field representing the parent level and do not need to manually edit it in the form, you can use a simple Single-Line Text Input to store the data. (For using ACL, see below)
To support hierarchical structures, you need to add a single-line text field in the data source and hide it to represent the parent-child relationship. The field ID is not required and can be named according to your project needs.
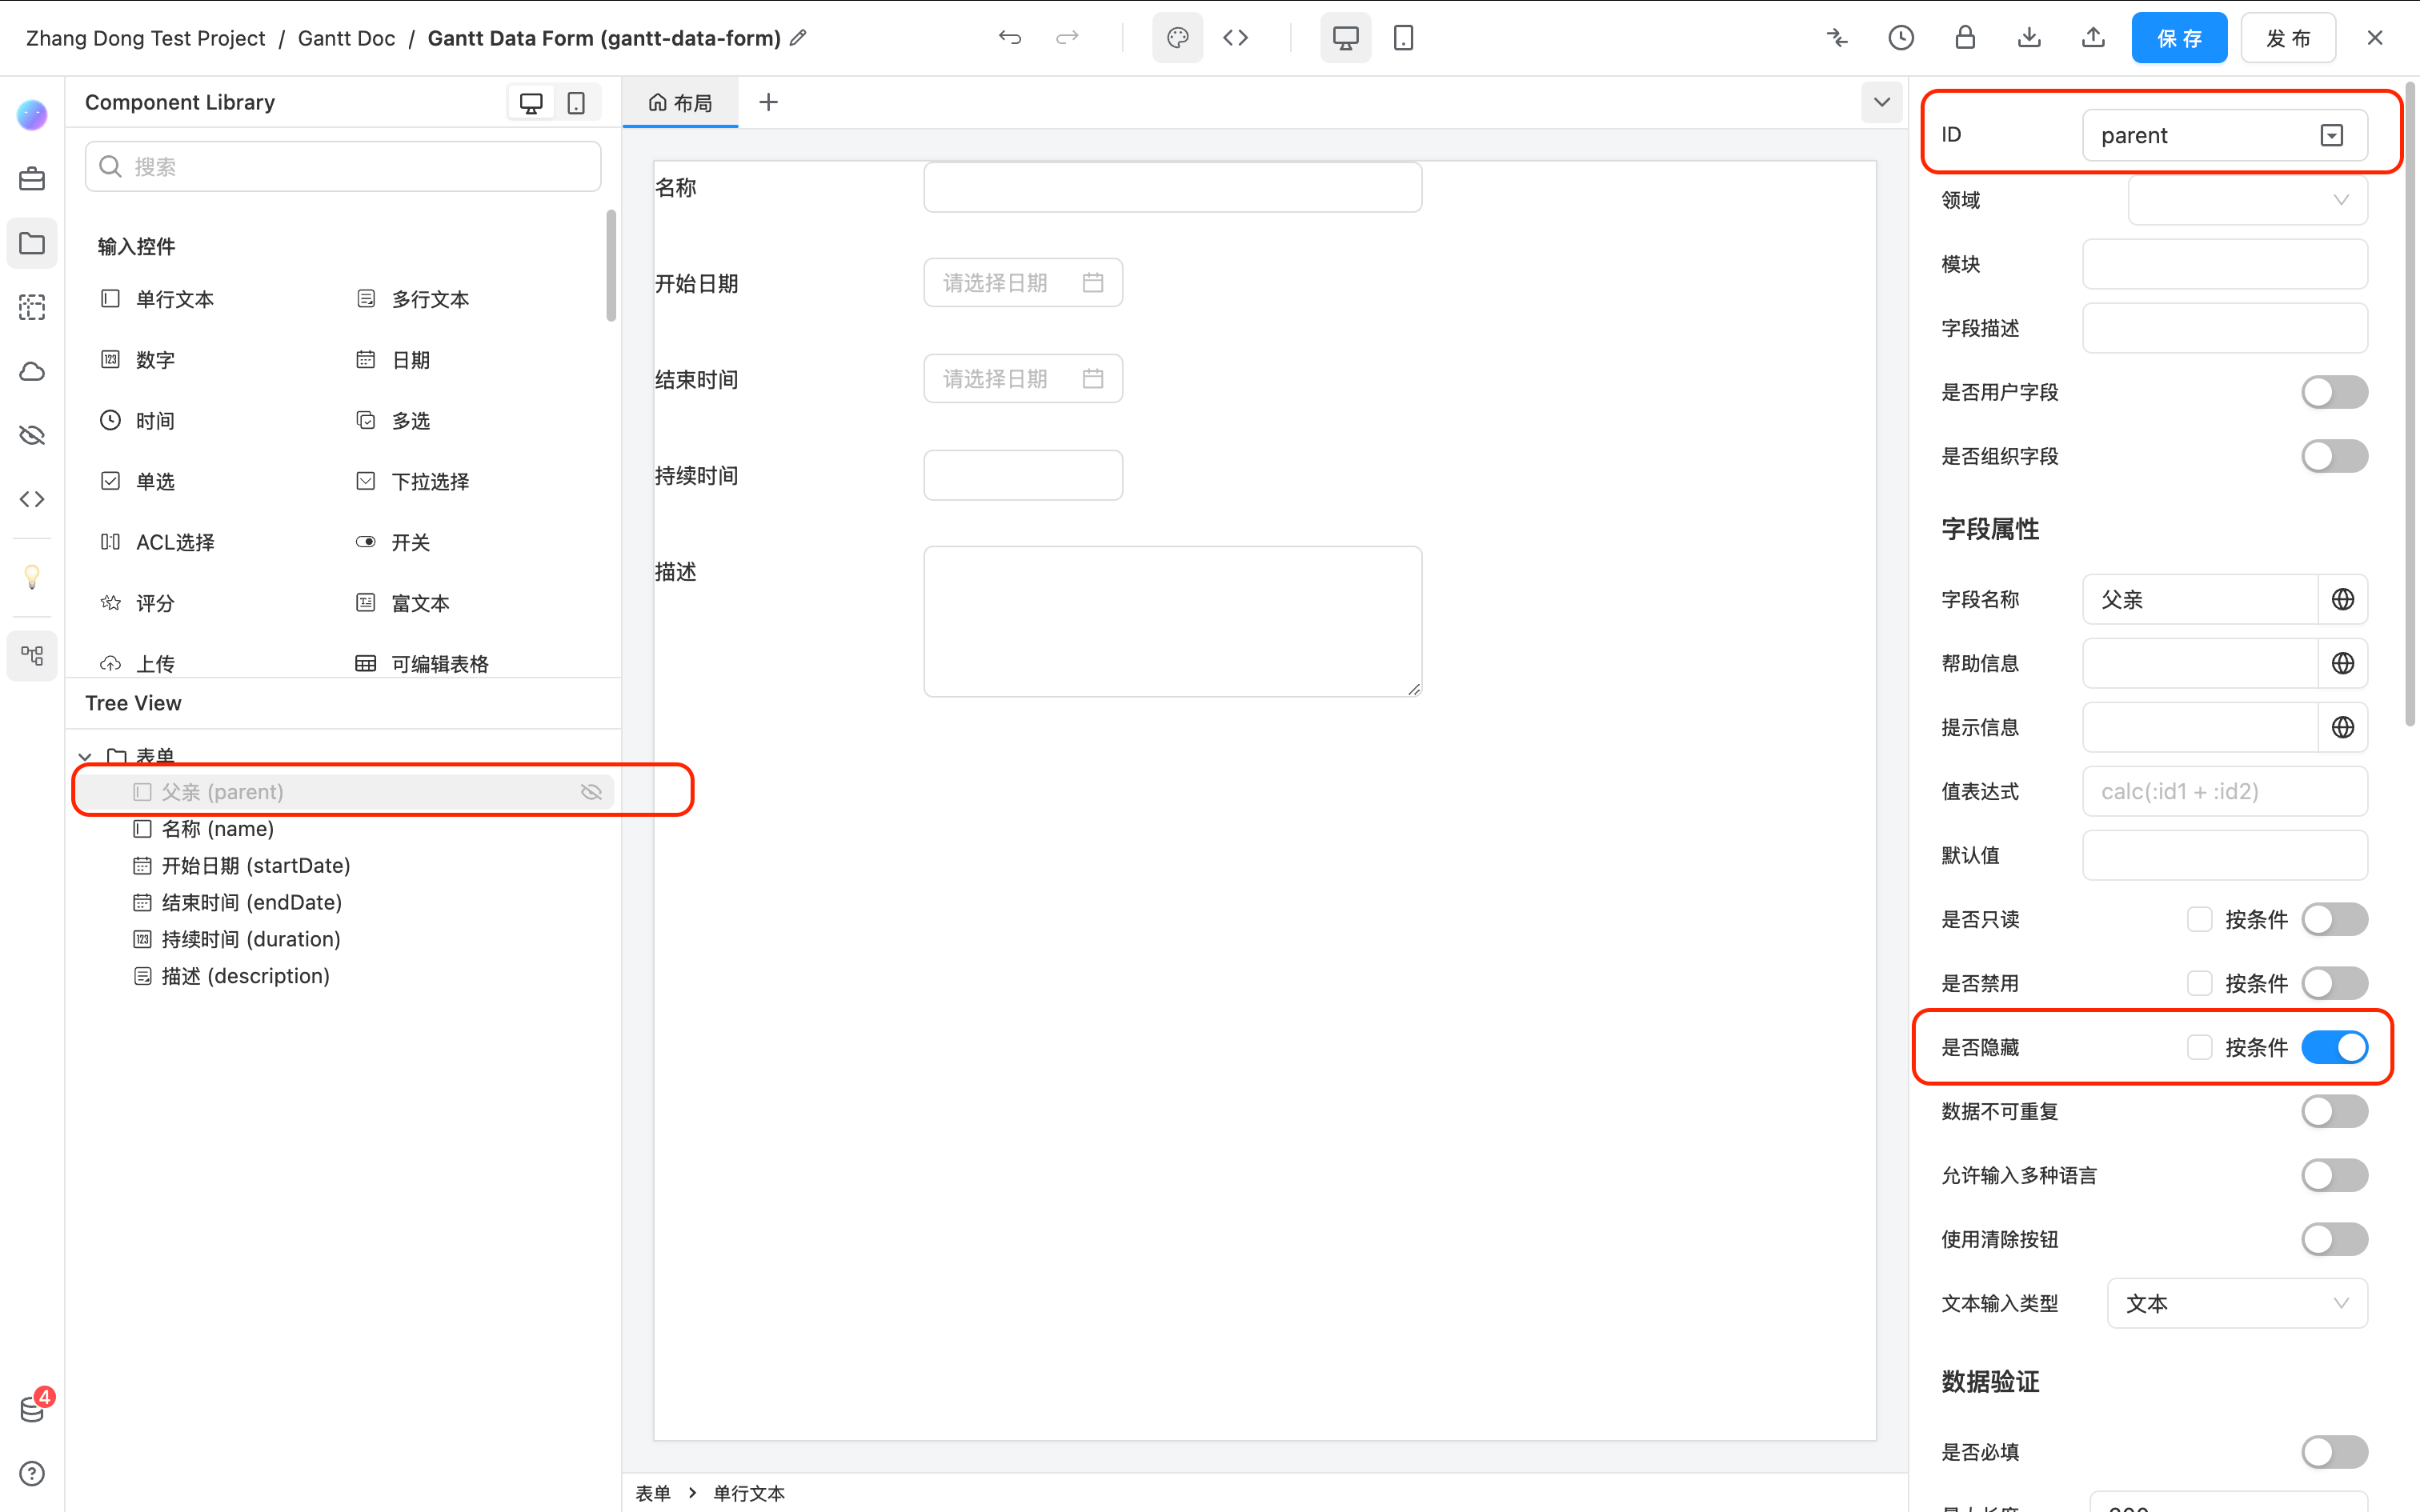
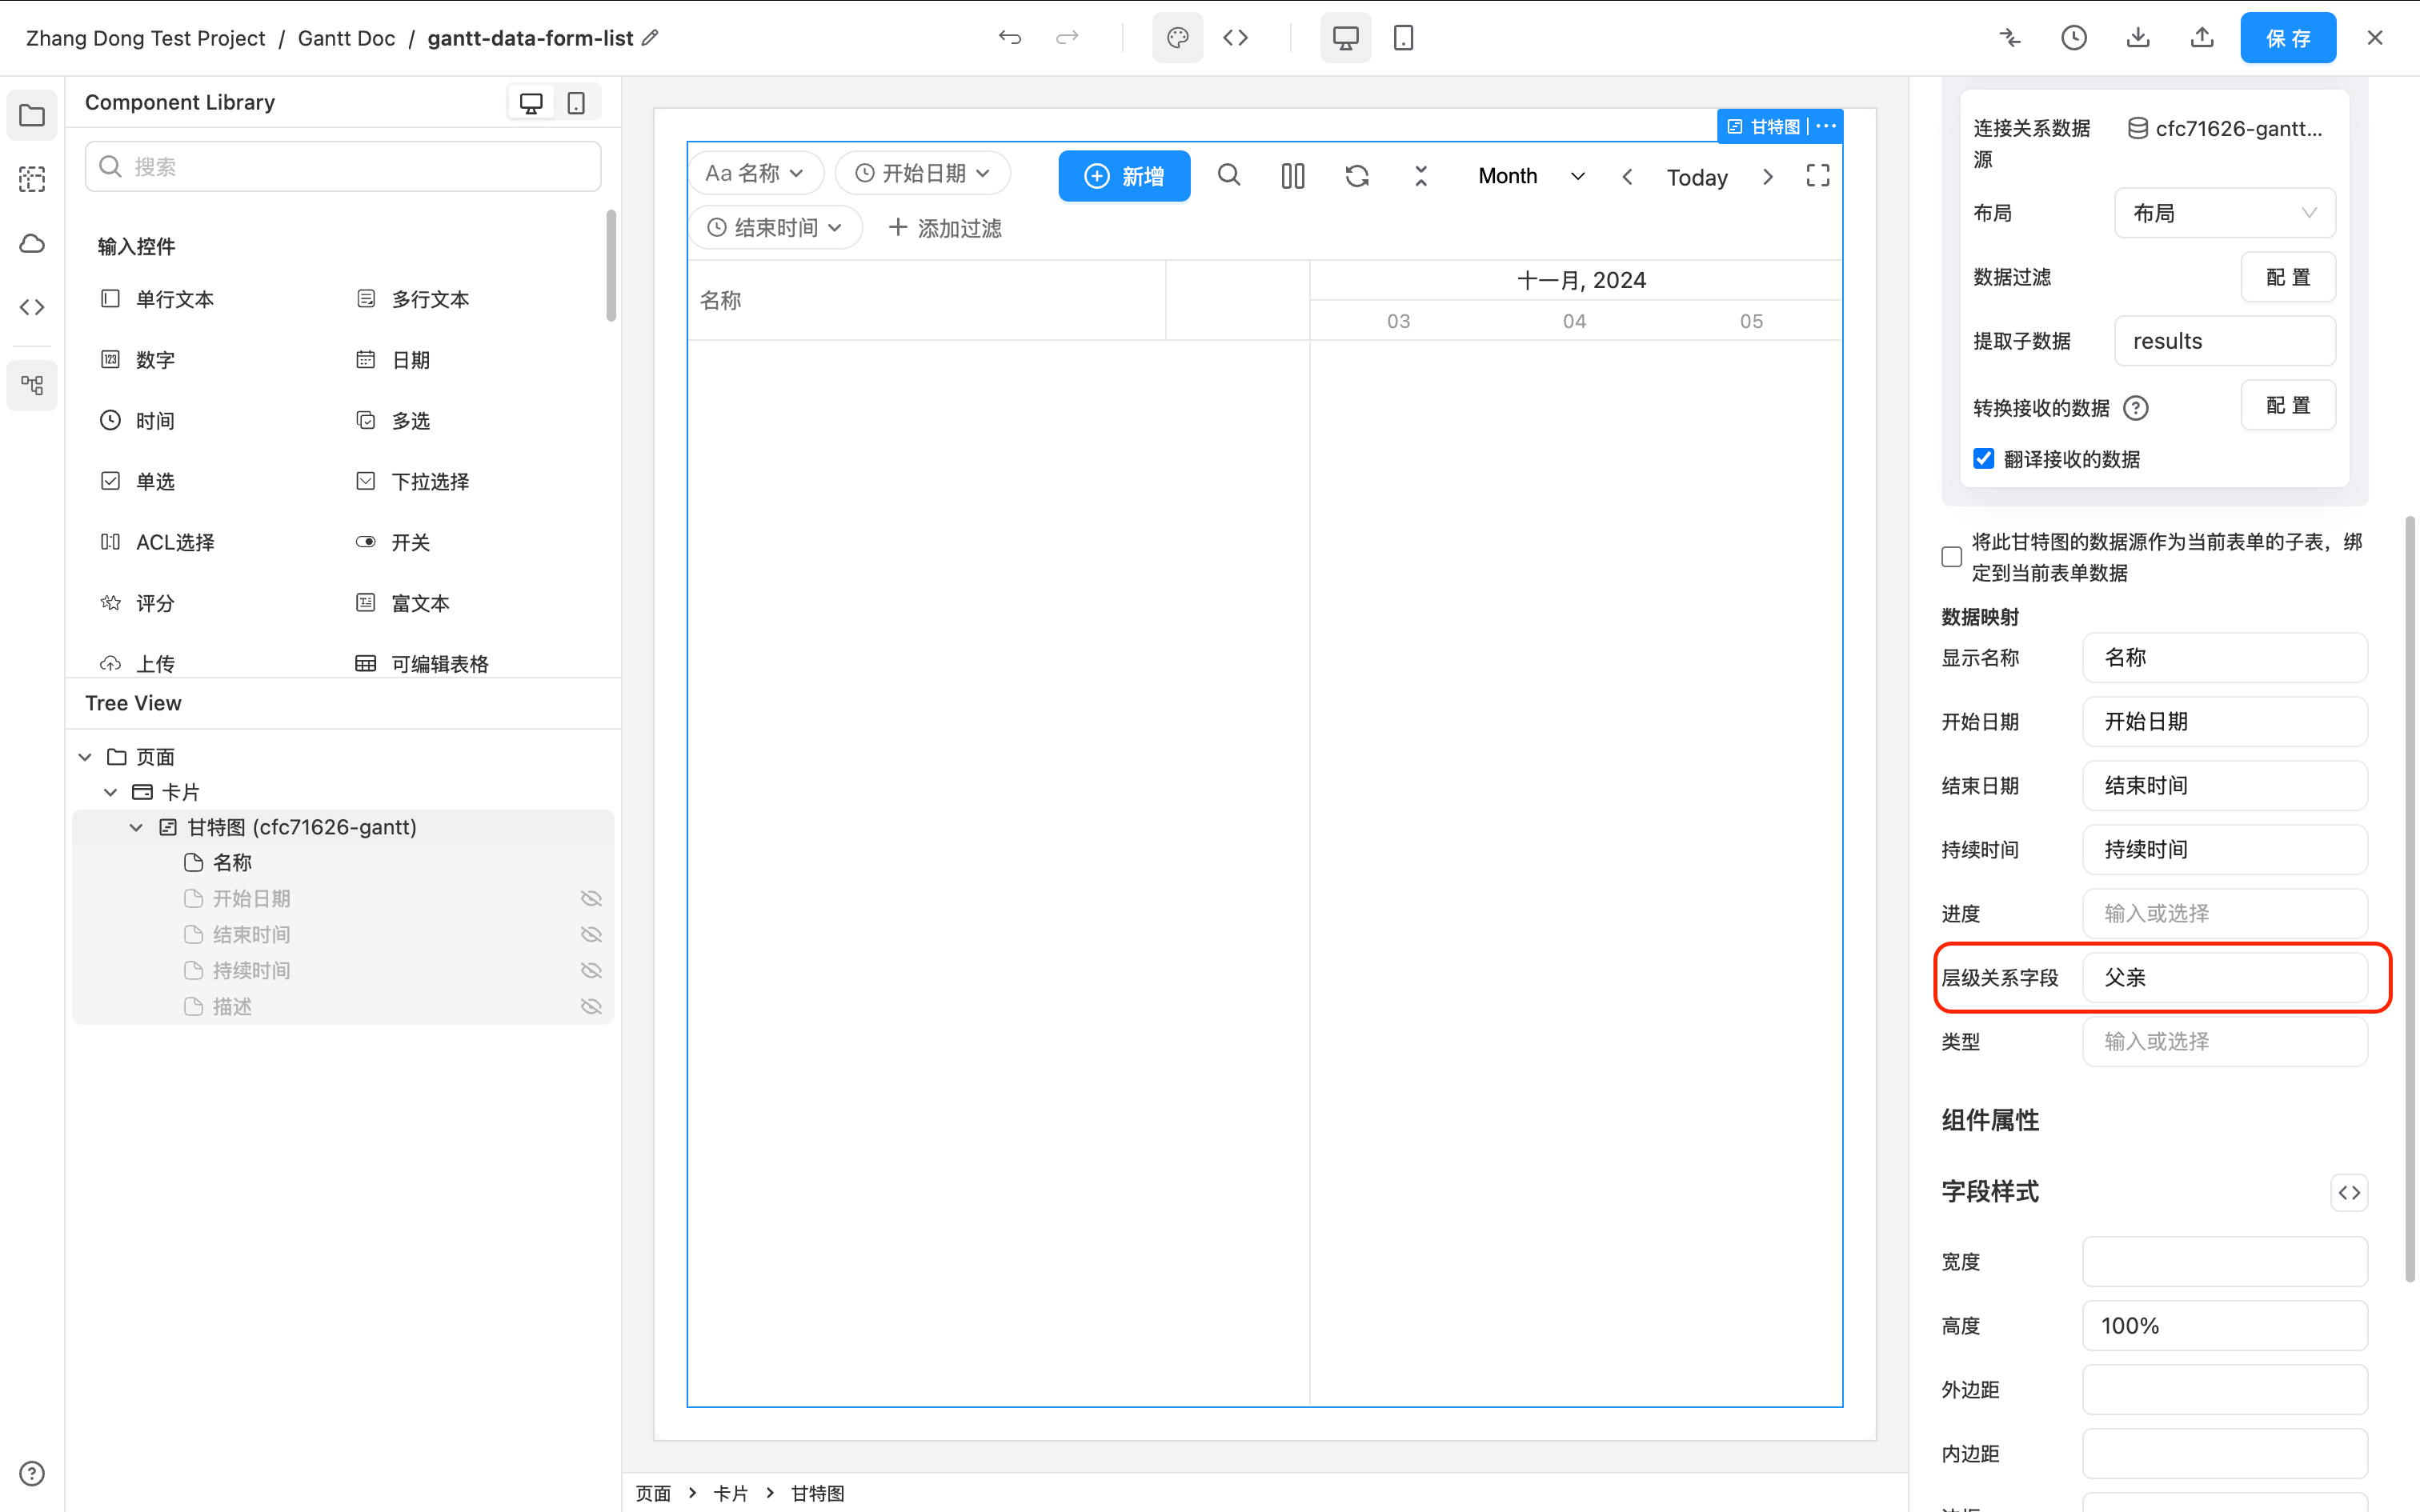
At the same time, in the Gantt component settings, select the added field as the "Hierarchical Relationship Field."
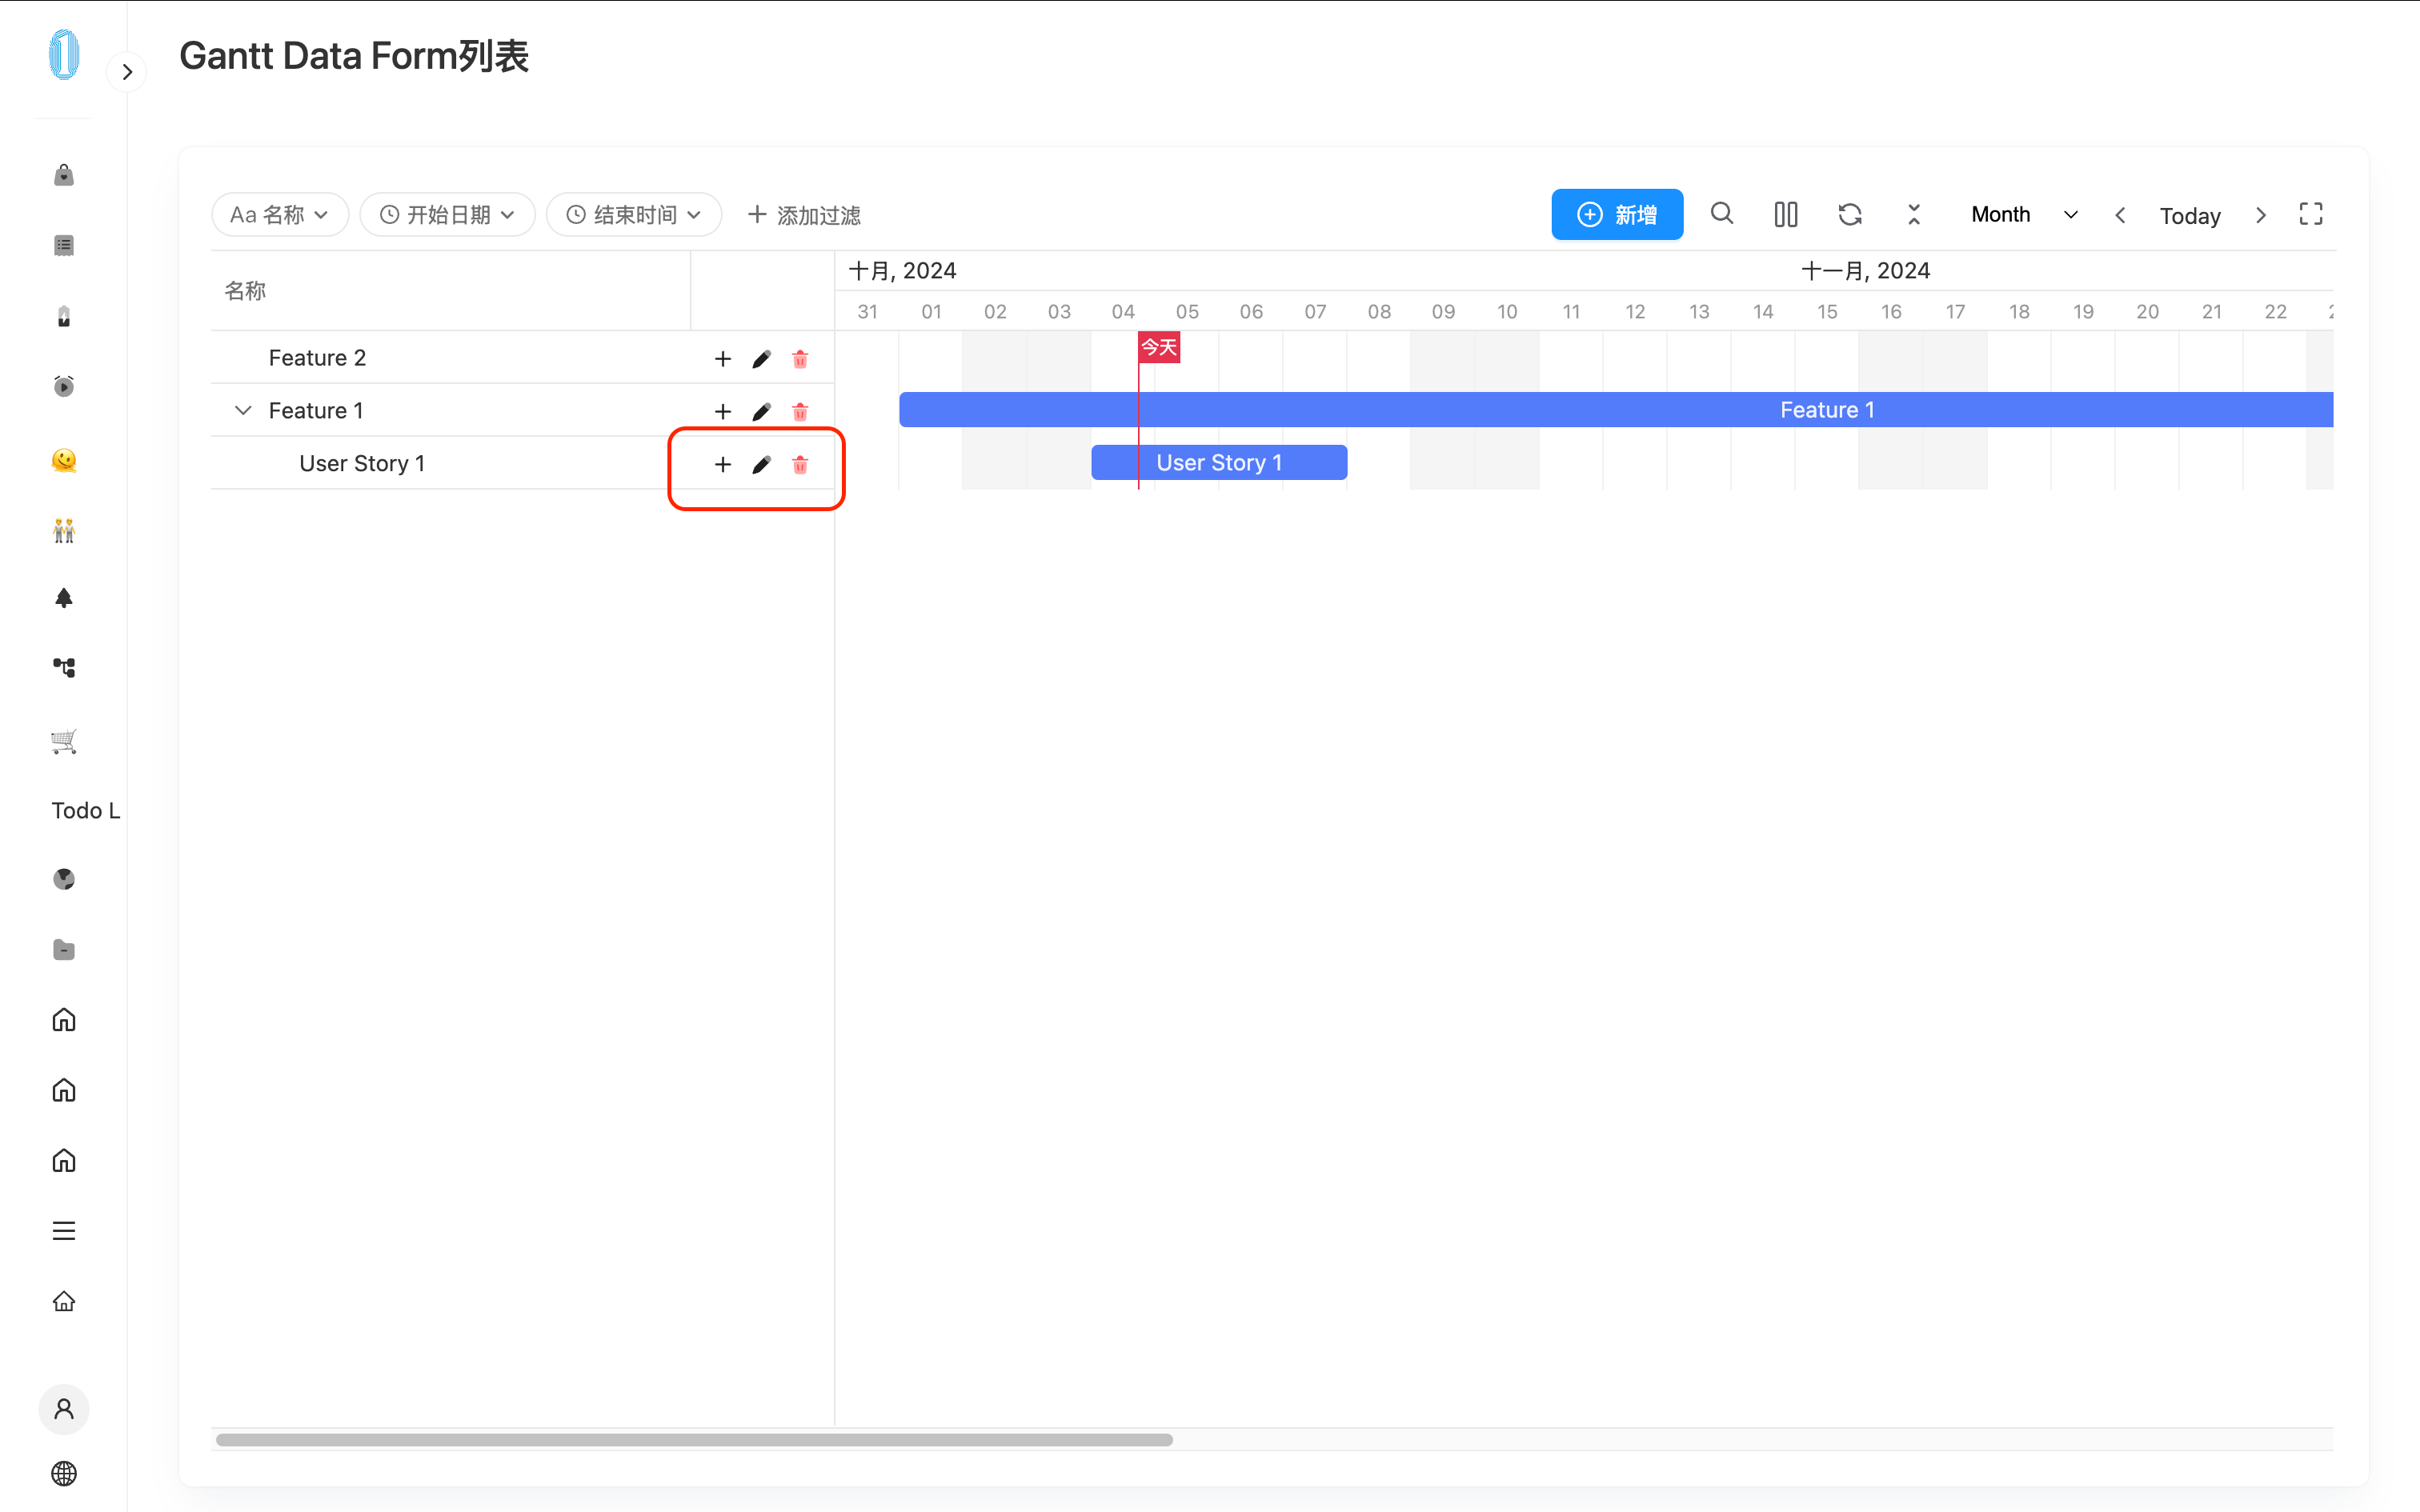
Now, when you visit the page, you will see a "+" button in the operation column for each task. Clicking it allows you to add a sub-task.
Using ACL/Select for Hierarchical Relationships
When you want to see the field representing the parent level in the form and can manually edit it, you can use an ACL or Dropdown Selection to store the data.
If the component type of the parent field (e.g., changing from Input to ACL), ID (token), mapping, or valueType properties change, you must go to the Gantt Chart settings and reselect the field. It is also recommended to delete and clear all sub-data in the Gantt Chart beforehand to avoid unknown data errors.
If the parent field undergoes the above property changes, you must reselect the field in the Gantt Chart settings.
For example:
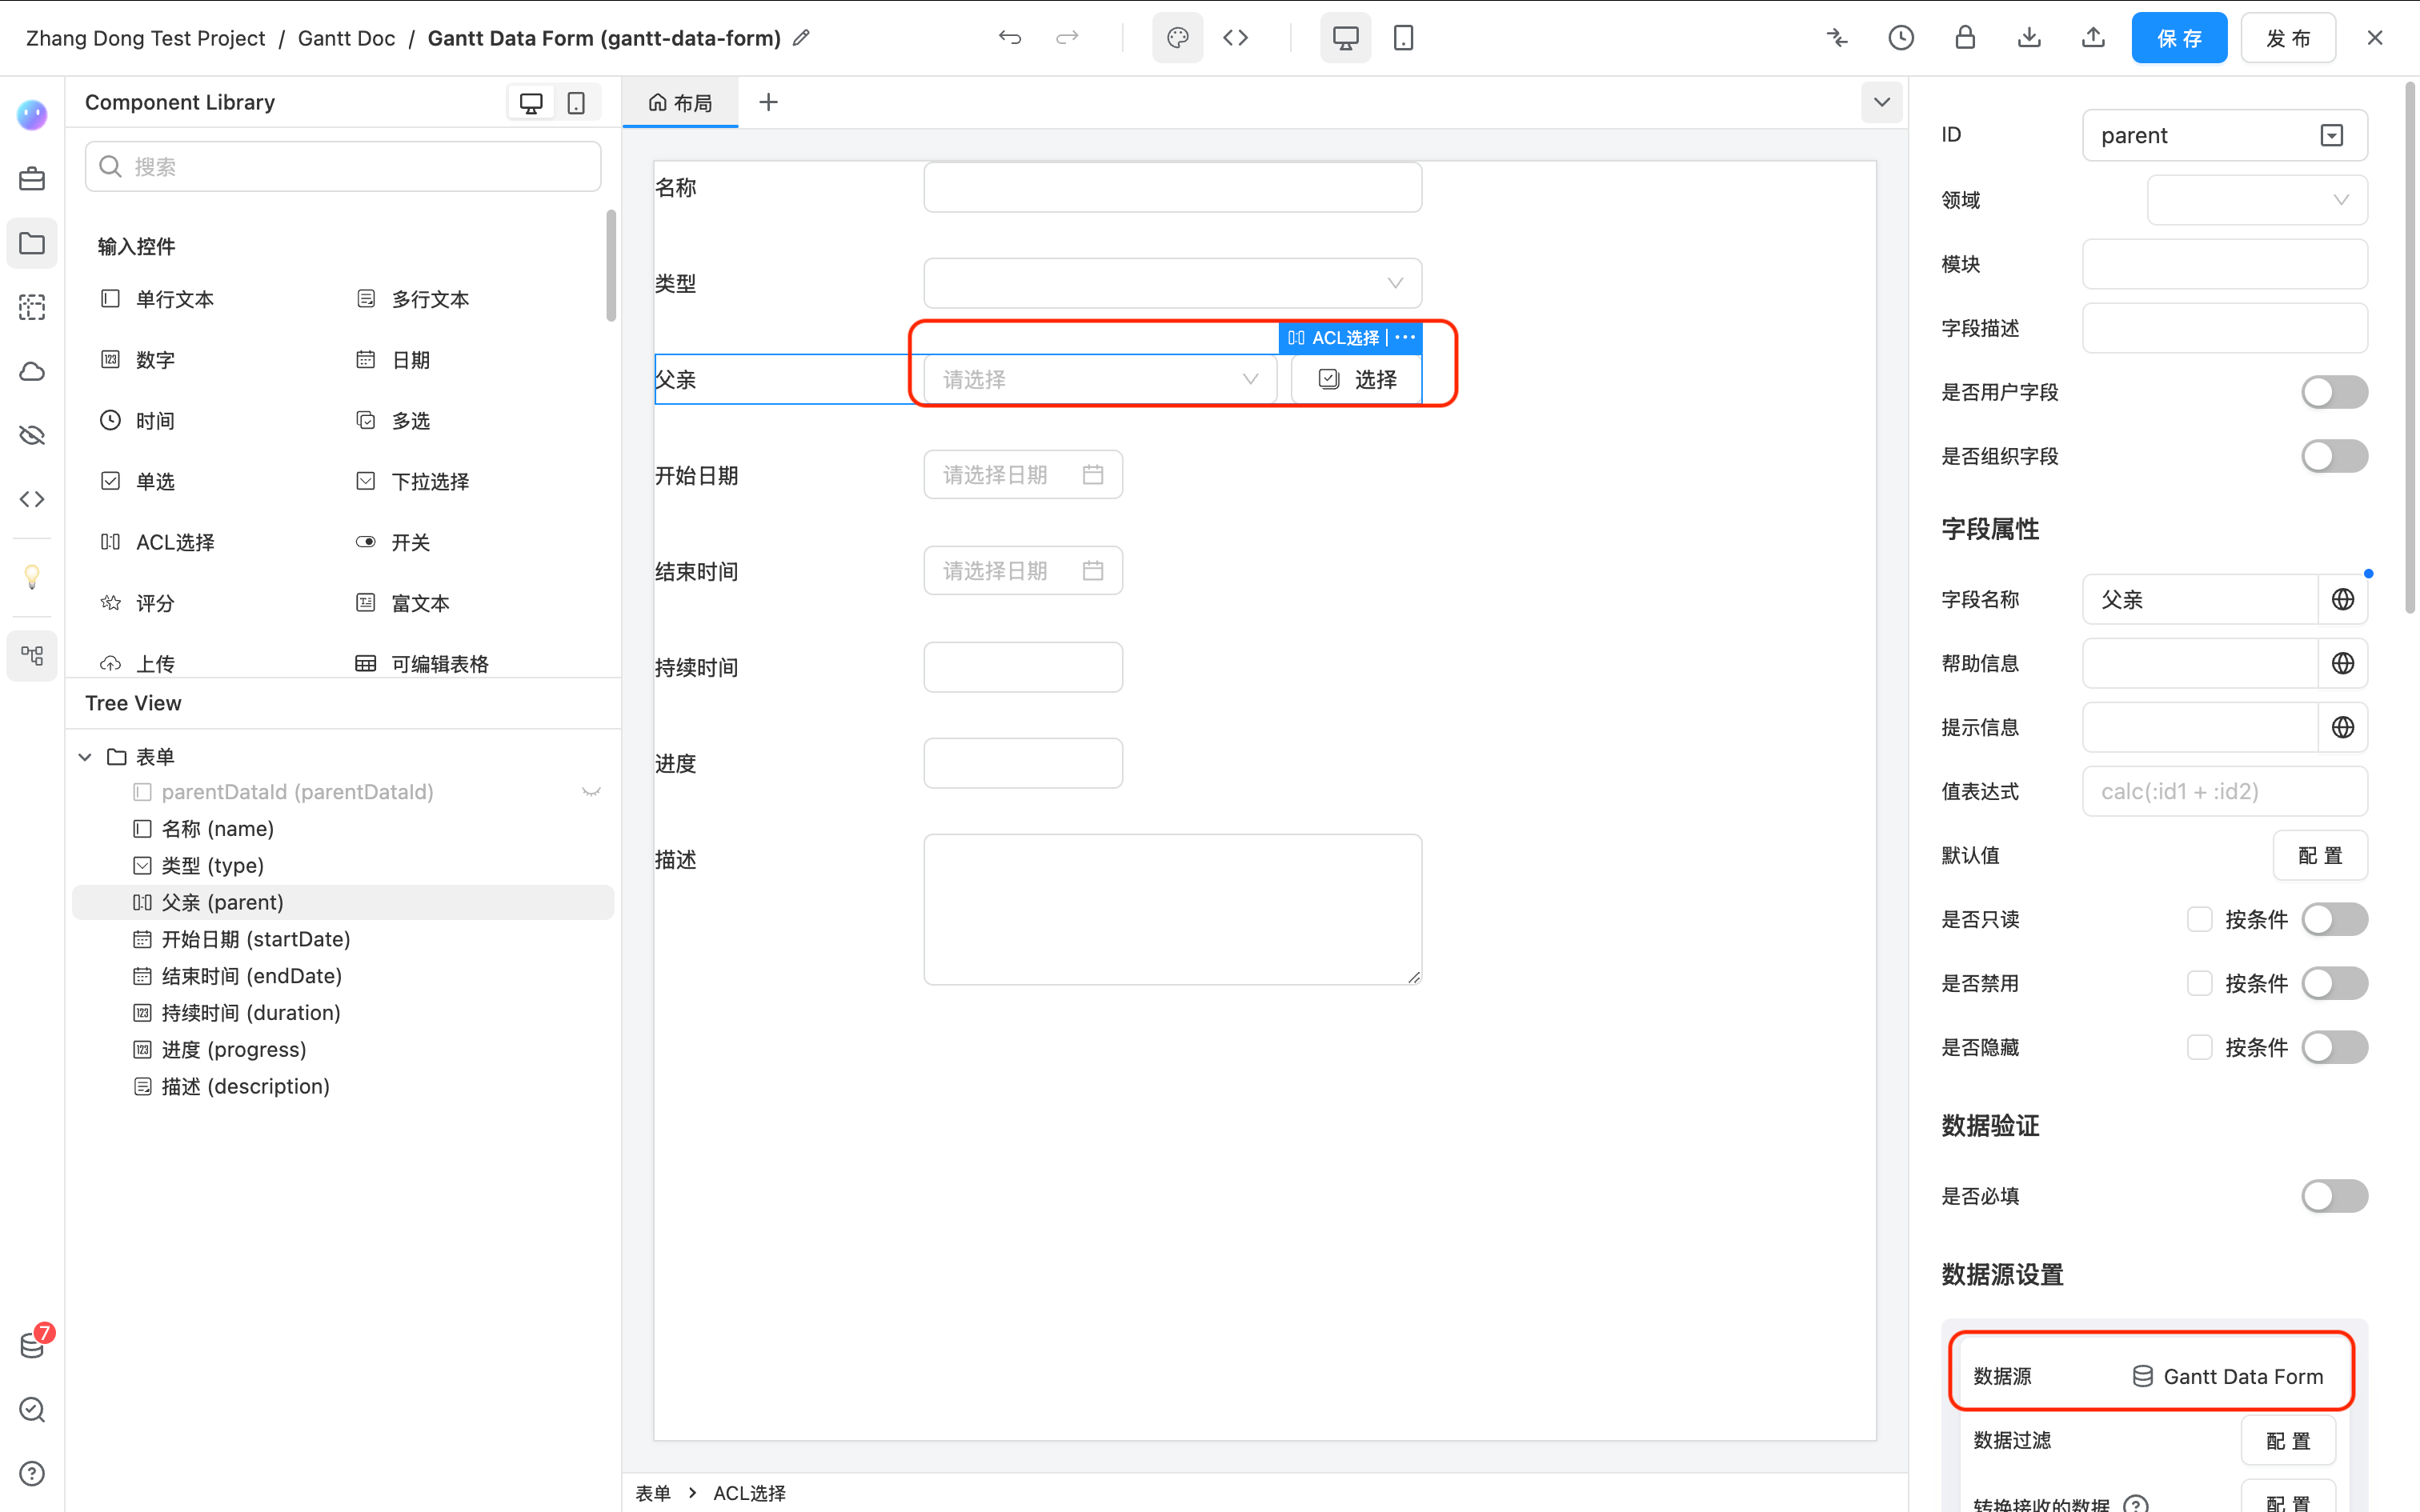
- I deleted the original hidden single-line text Input in the Gantt Data Form and added an ACL with the ID (token)
parent, with the data source set to the same form.
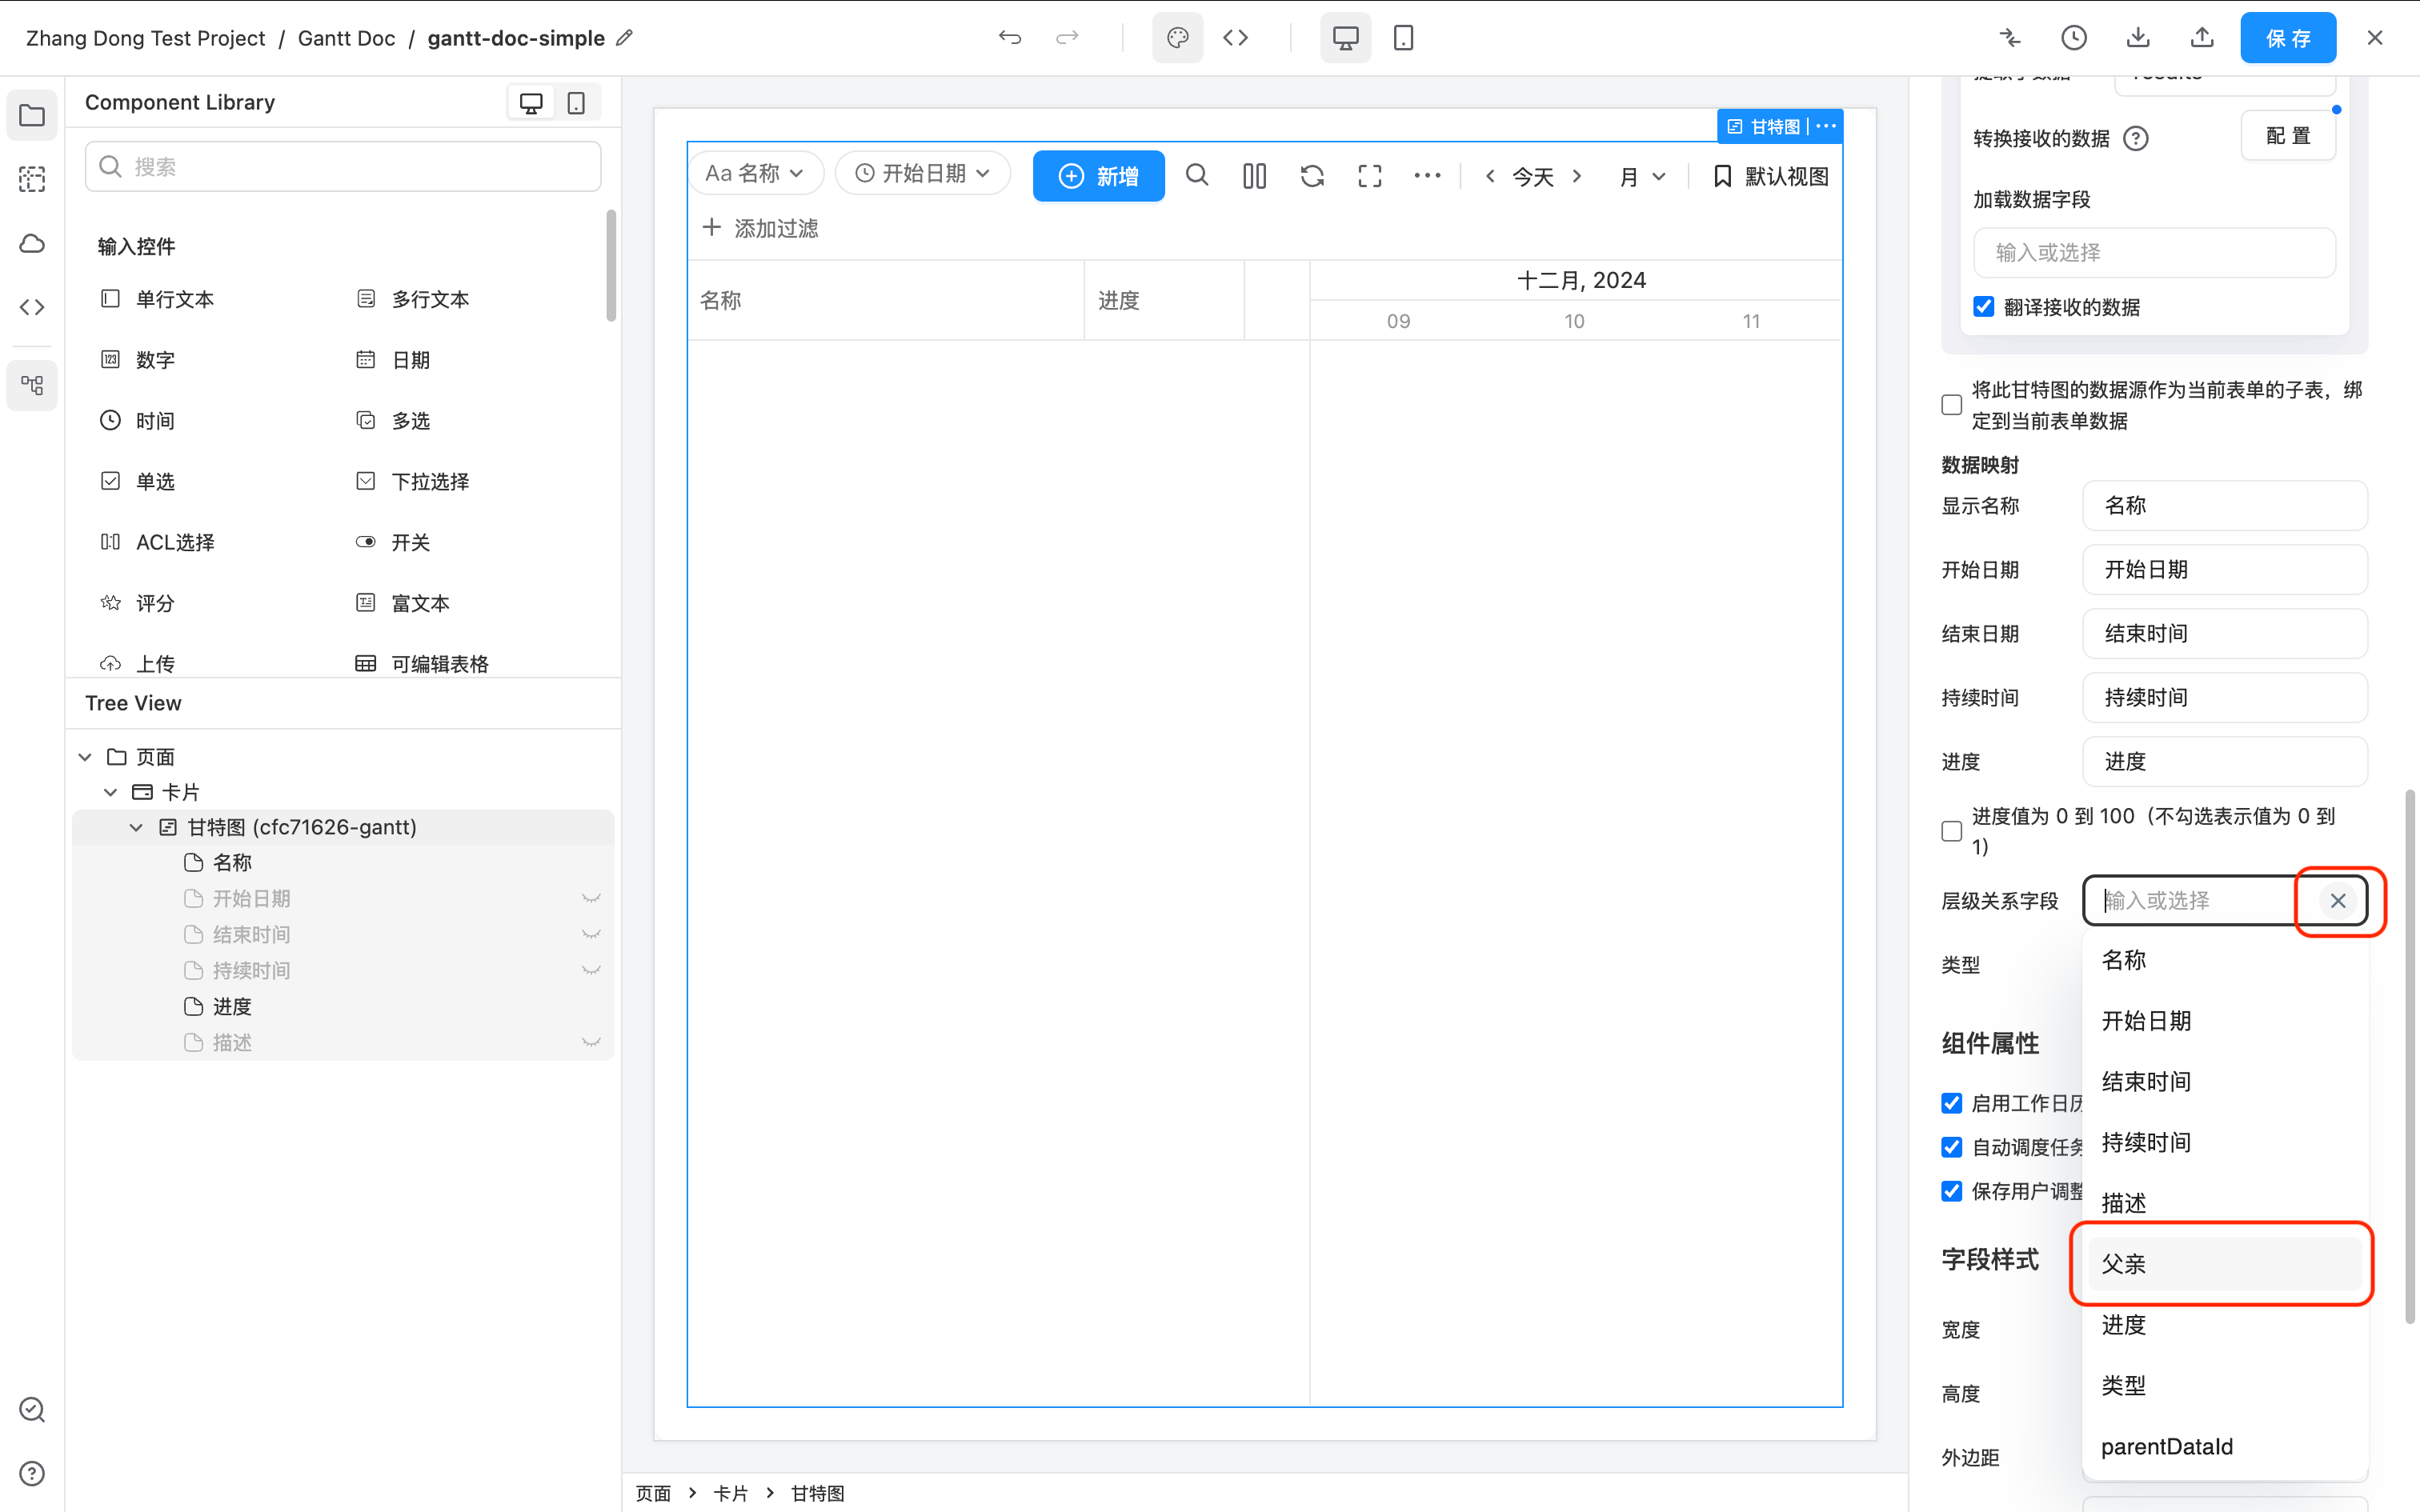
- In the Gantt Chart settings, first click the 'X' icon next to the Hierarchical Relationship Field to delete it, and then reselect the newly added ACL Parent field from the dropdown options.
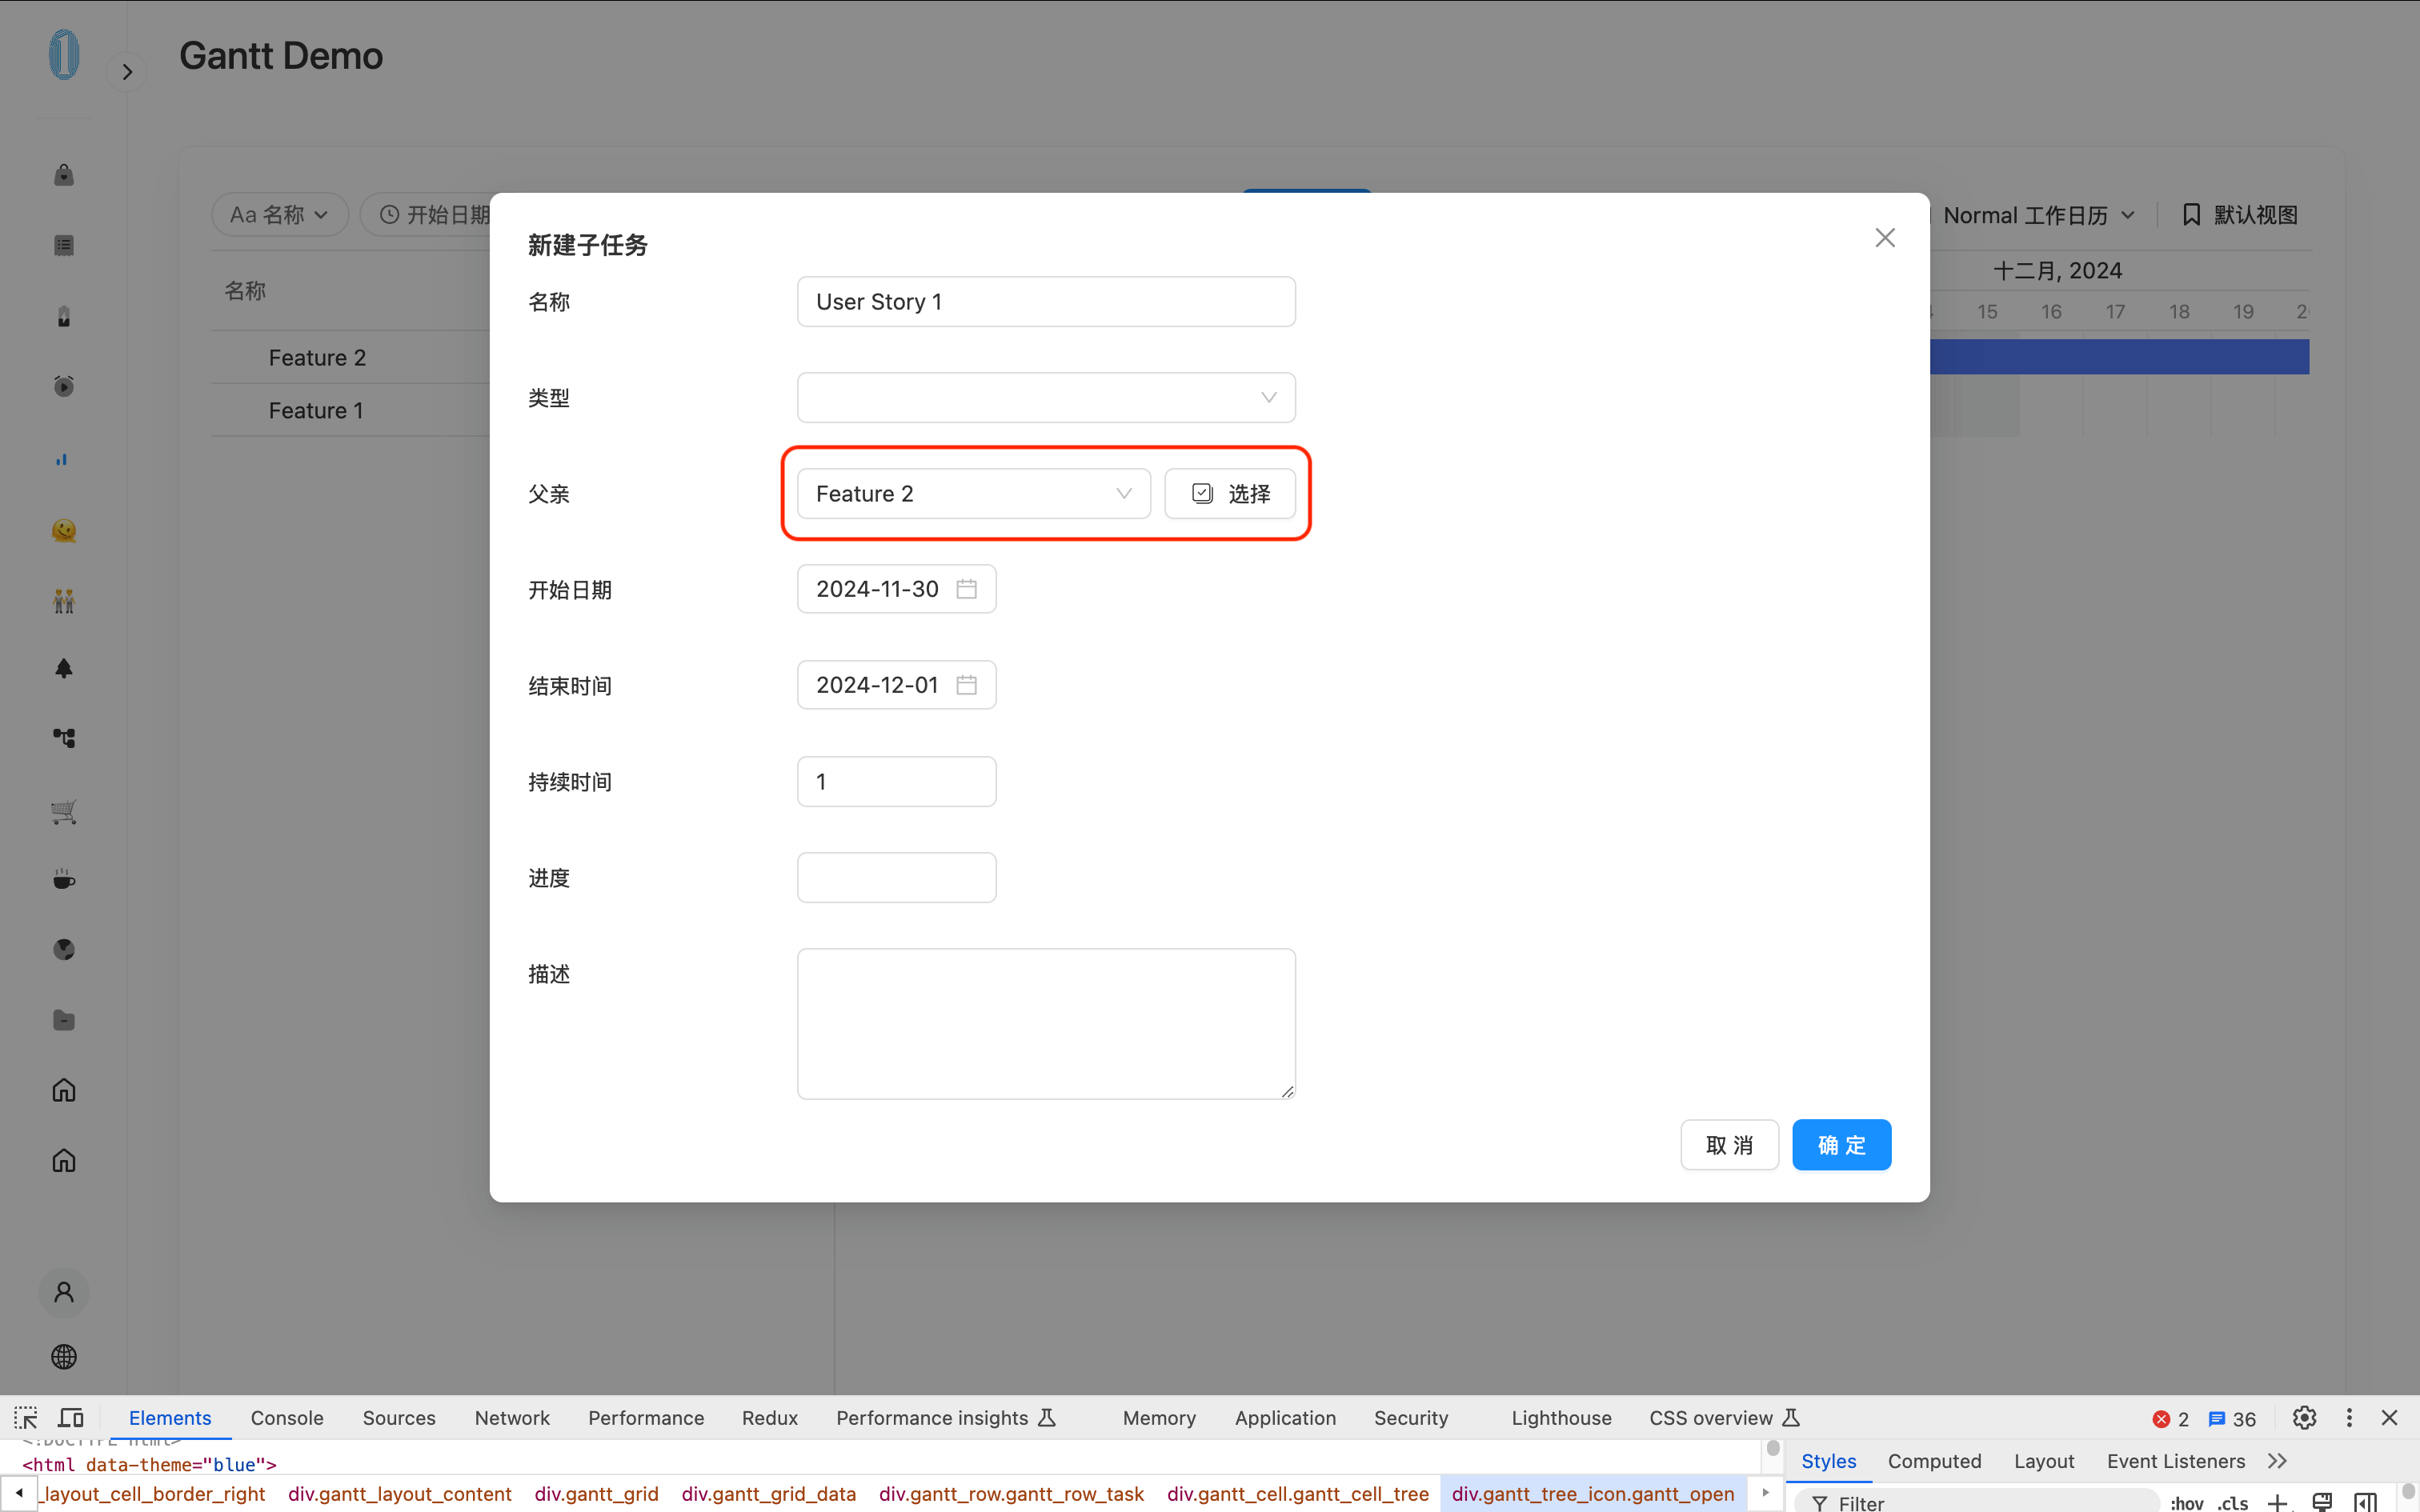
- Now, go to the preview page. Delete the sub-task User Story 1 under Feature 1. Then click the
+icon under Feature 2 to create a new task. As shown in the figure below, the Parent field in the Dialog is an ACL and is automatically filled withFeature 2.
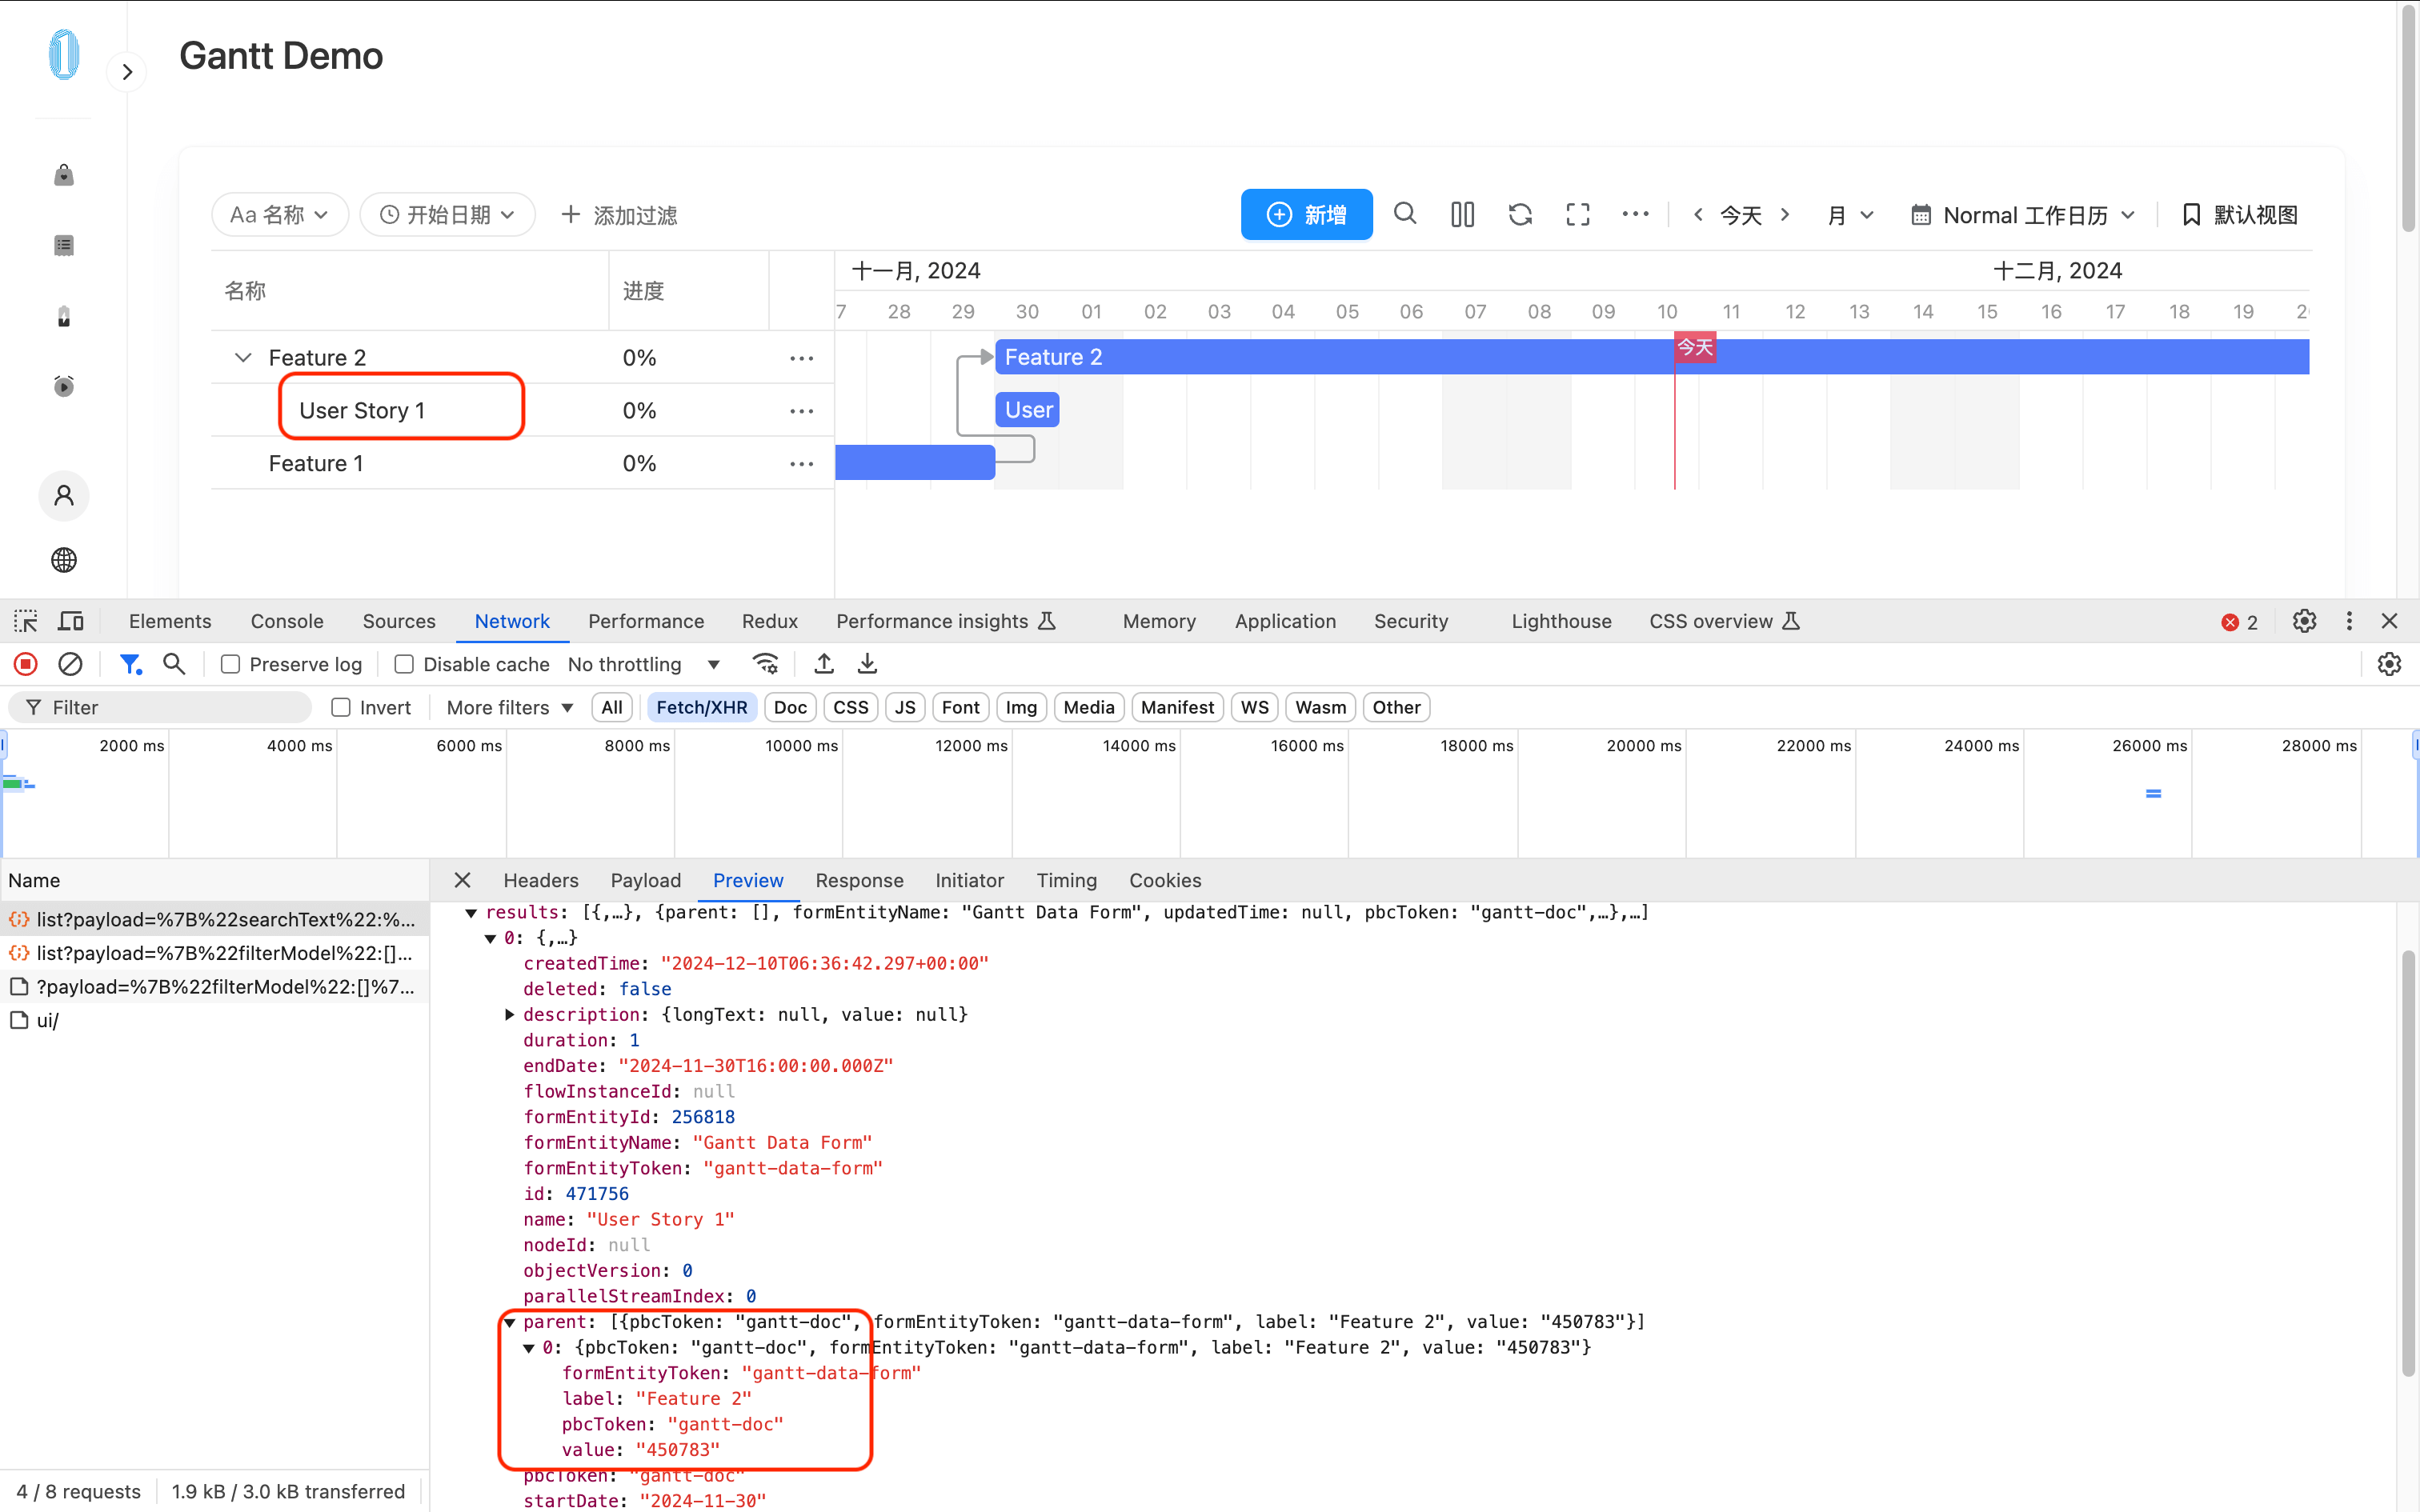
- Save the changes and open the browser's Network panel. Click the refresh button in the upper right corner of the Gantt Chart toolbar. You can see that the returned data now has the
parentfield in the standard ACL data format.
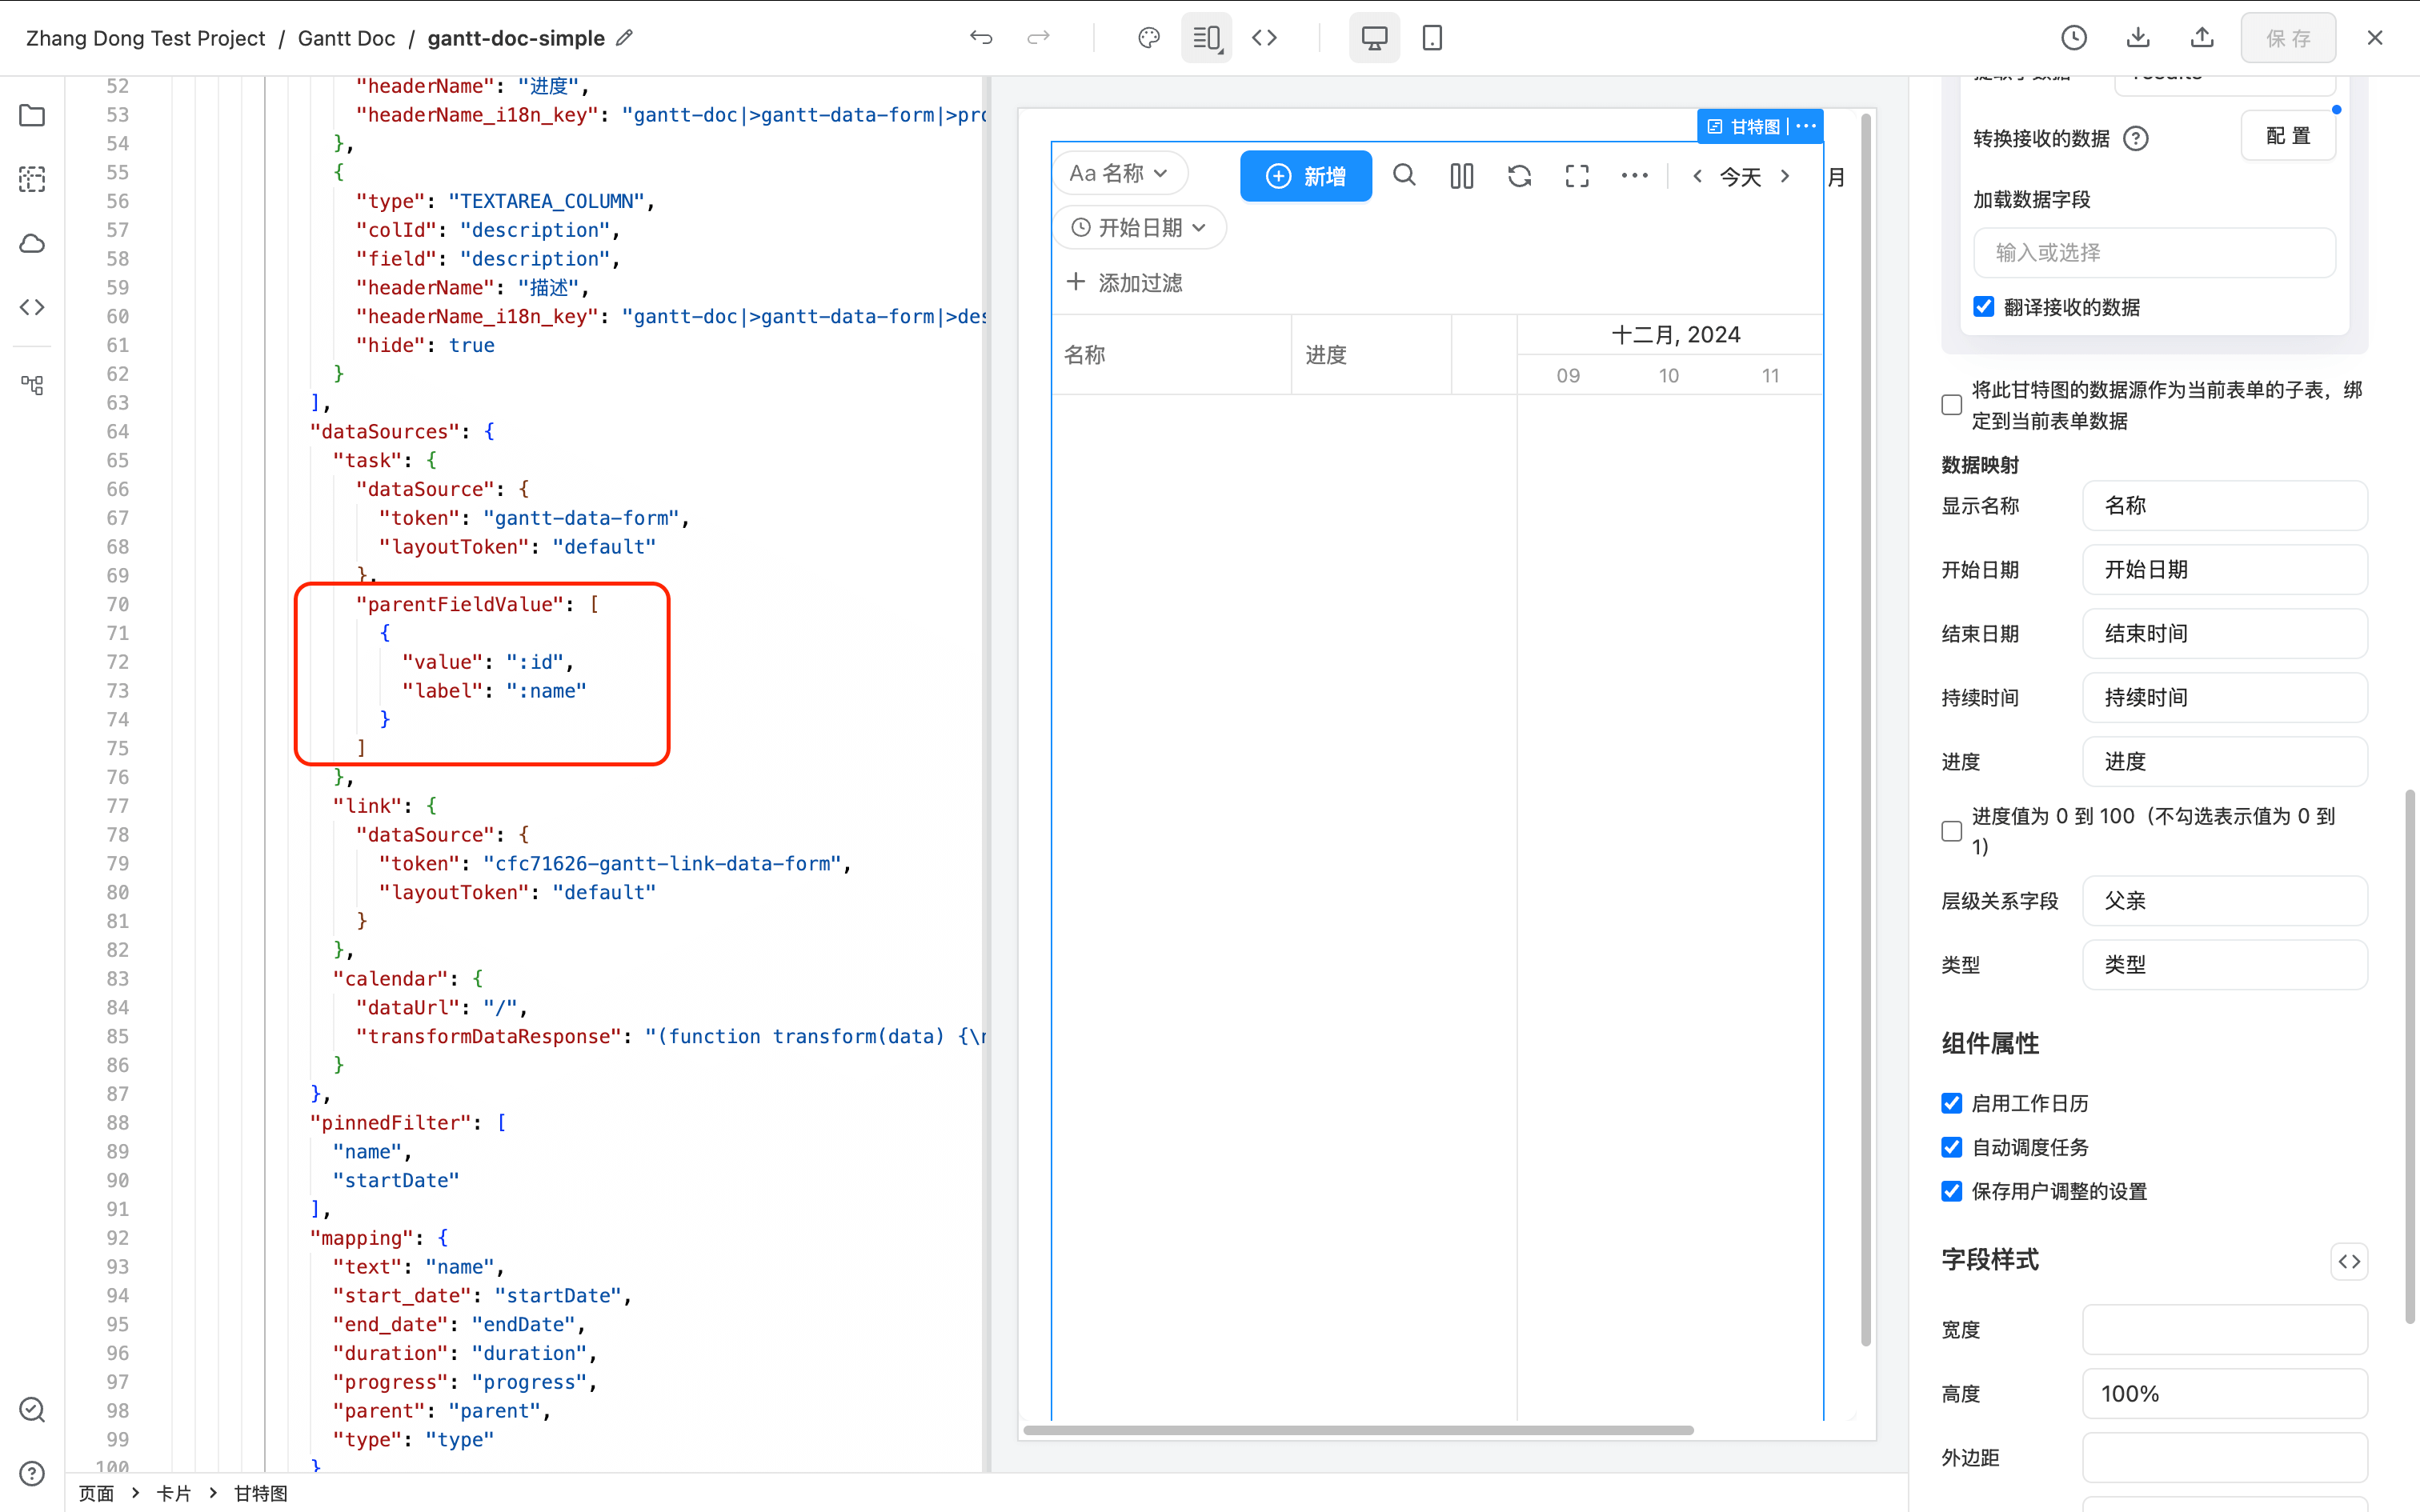
If the above steps do not succeed, open the JSON mode of the Gantt Chart and check if the parentFieldValue property of the data source is in the correct ACL data format. If not, you can manually modify it.
Supporting Progress
To support progress tracking, you need to add a "Number" component in the data source to store the task's progress. The field ID is not required and can be named according to your project needs.
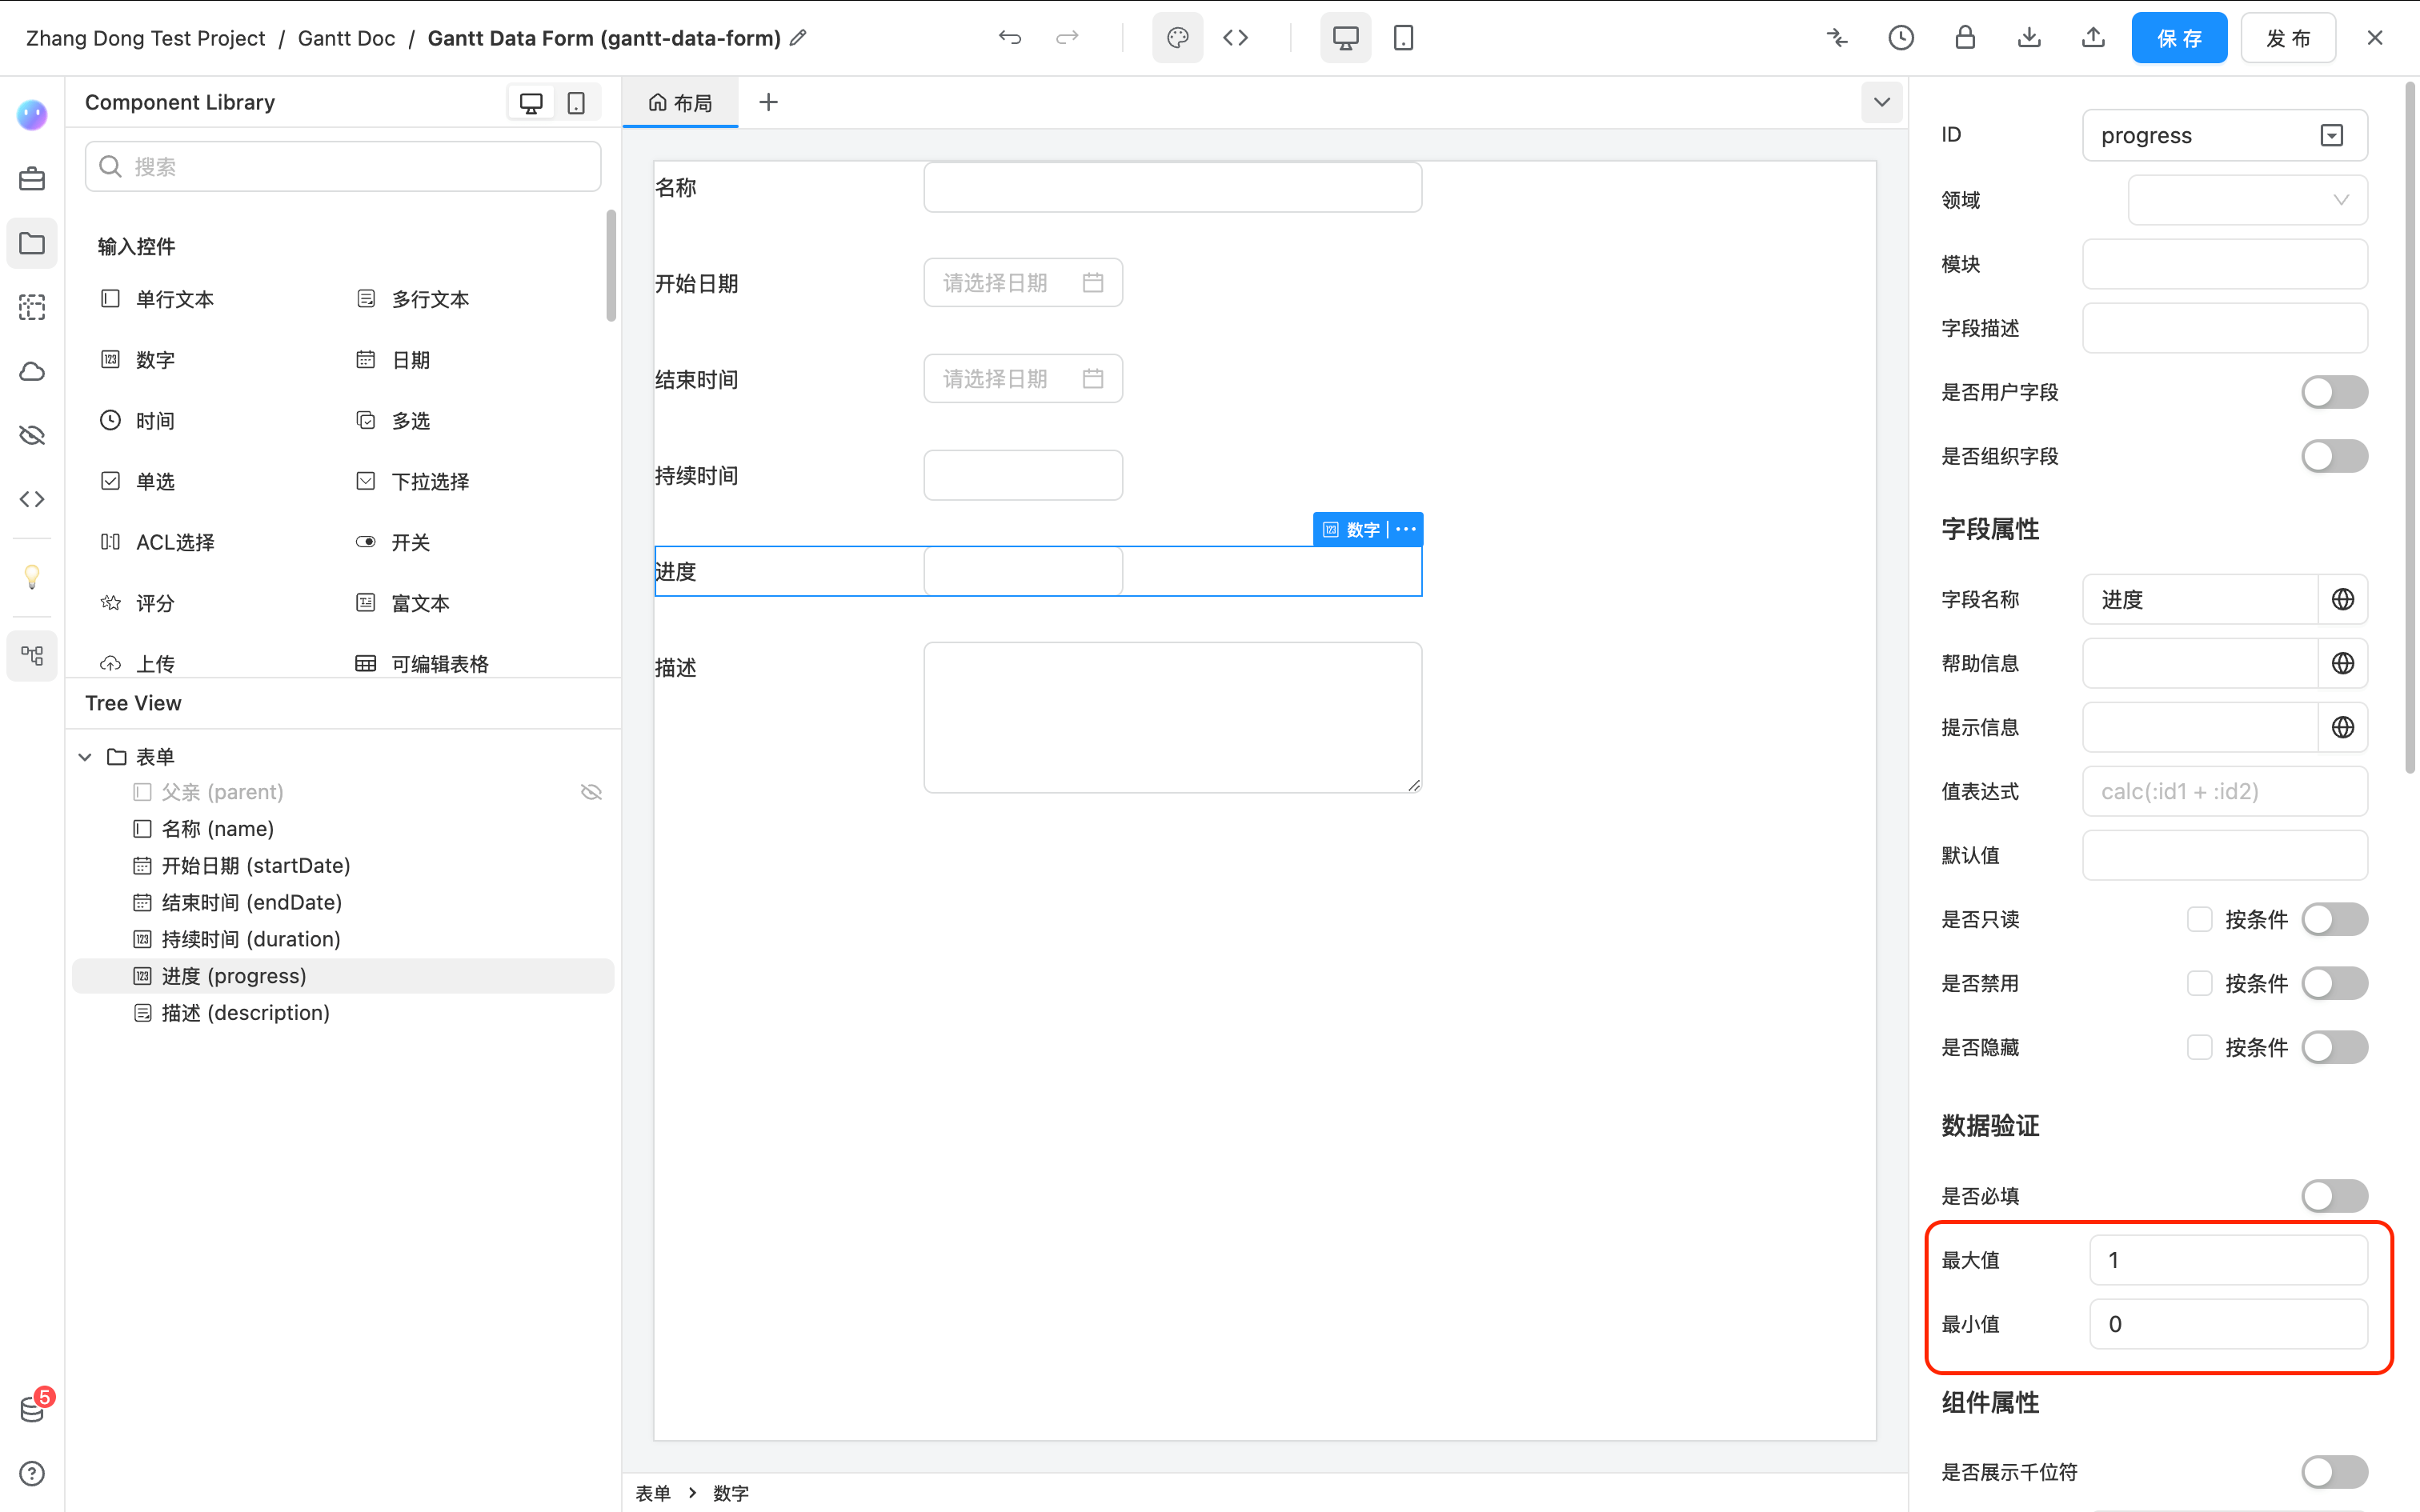
At the same time, in the Gantt component settings, select the added field as the "Progress."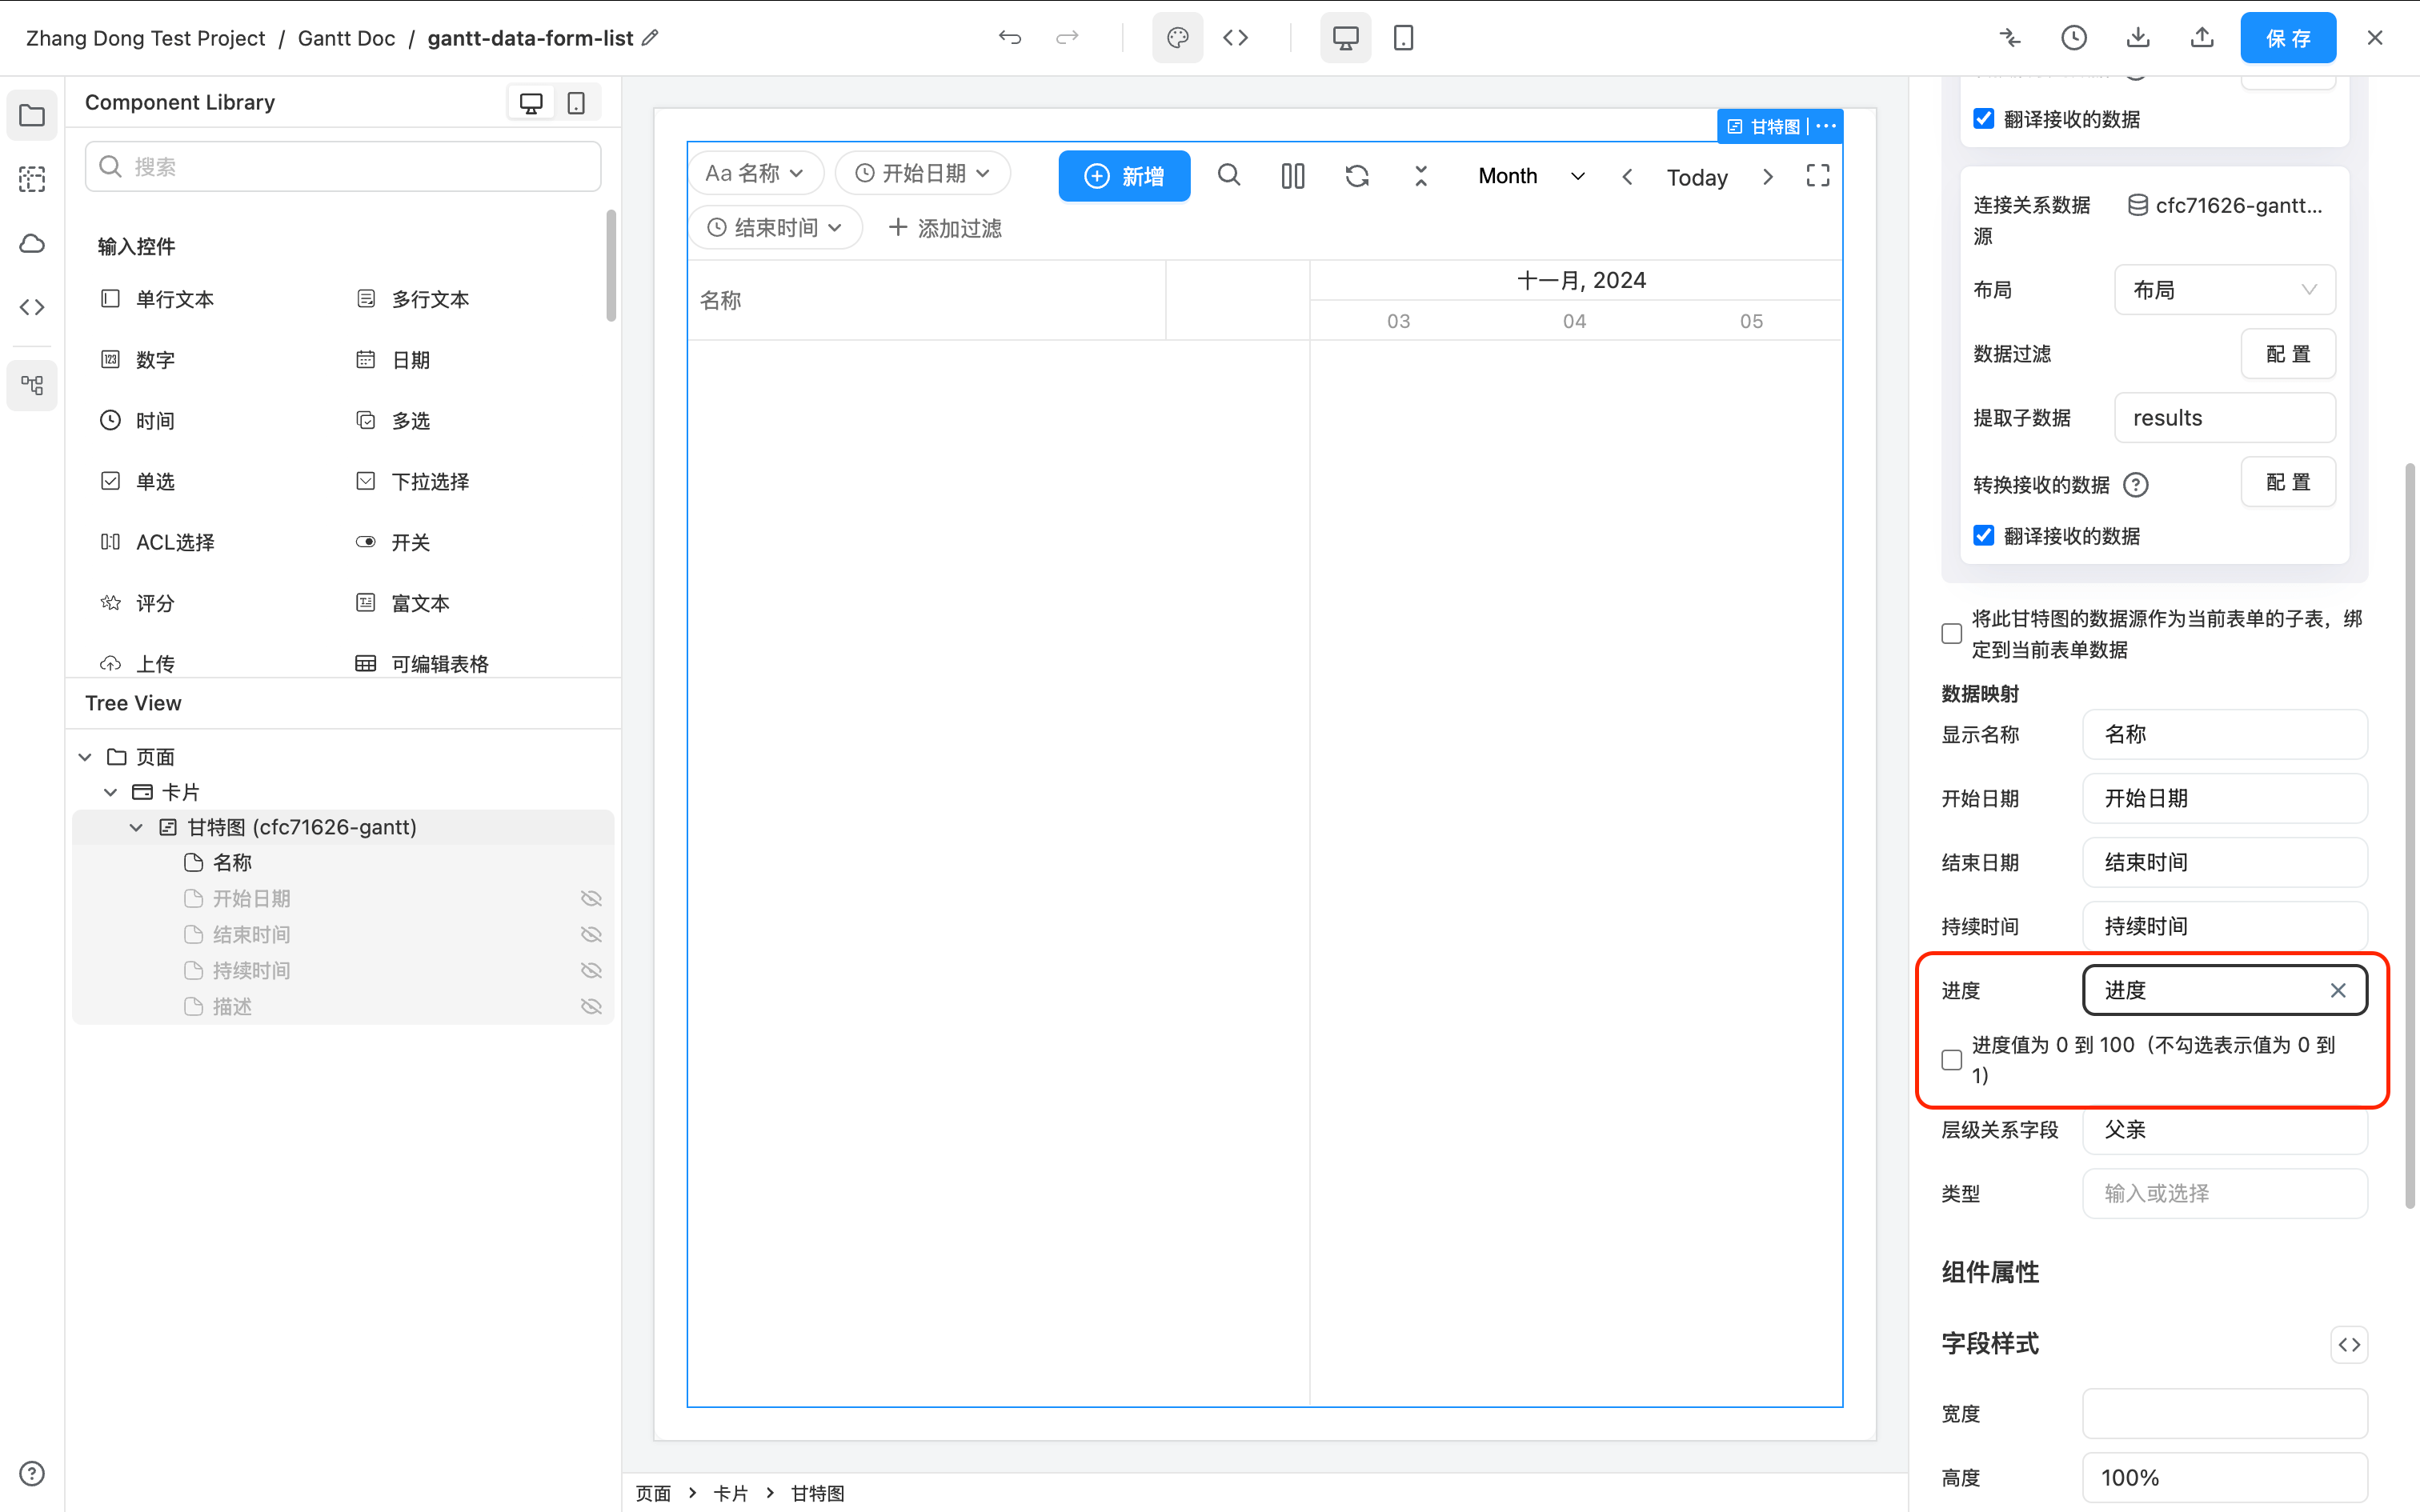
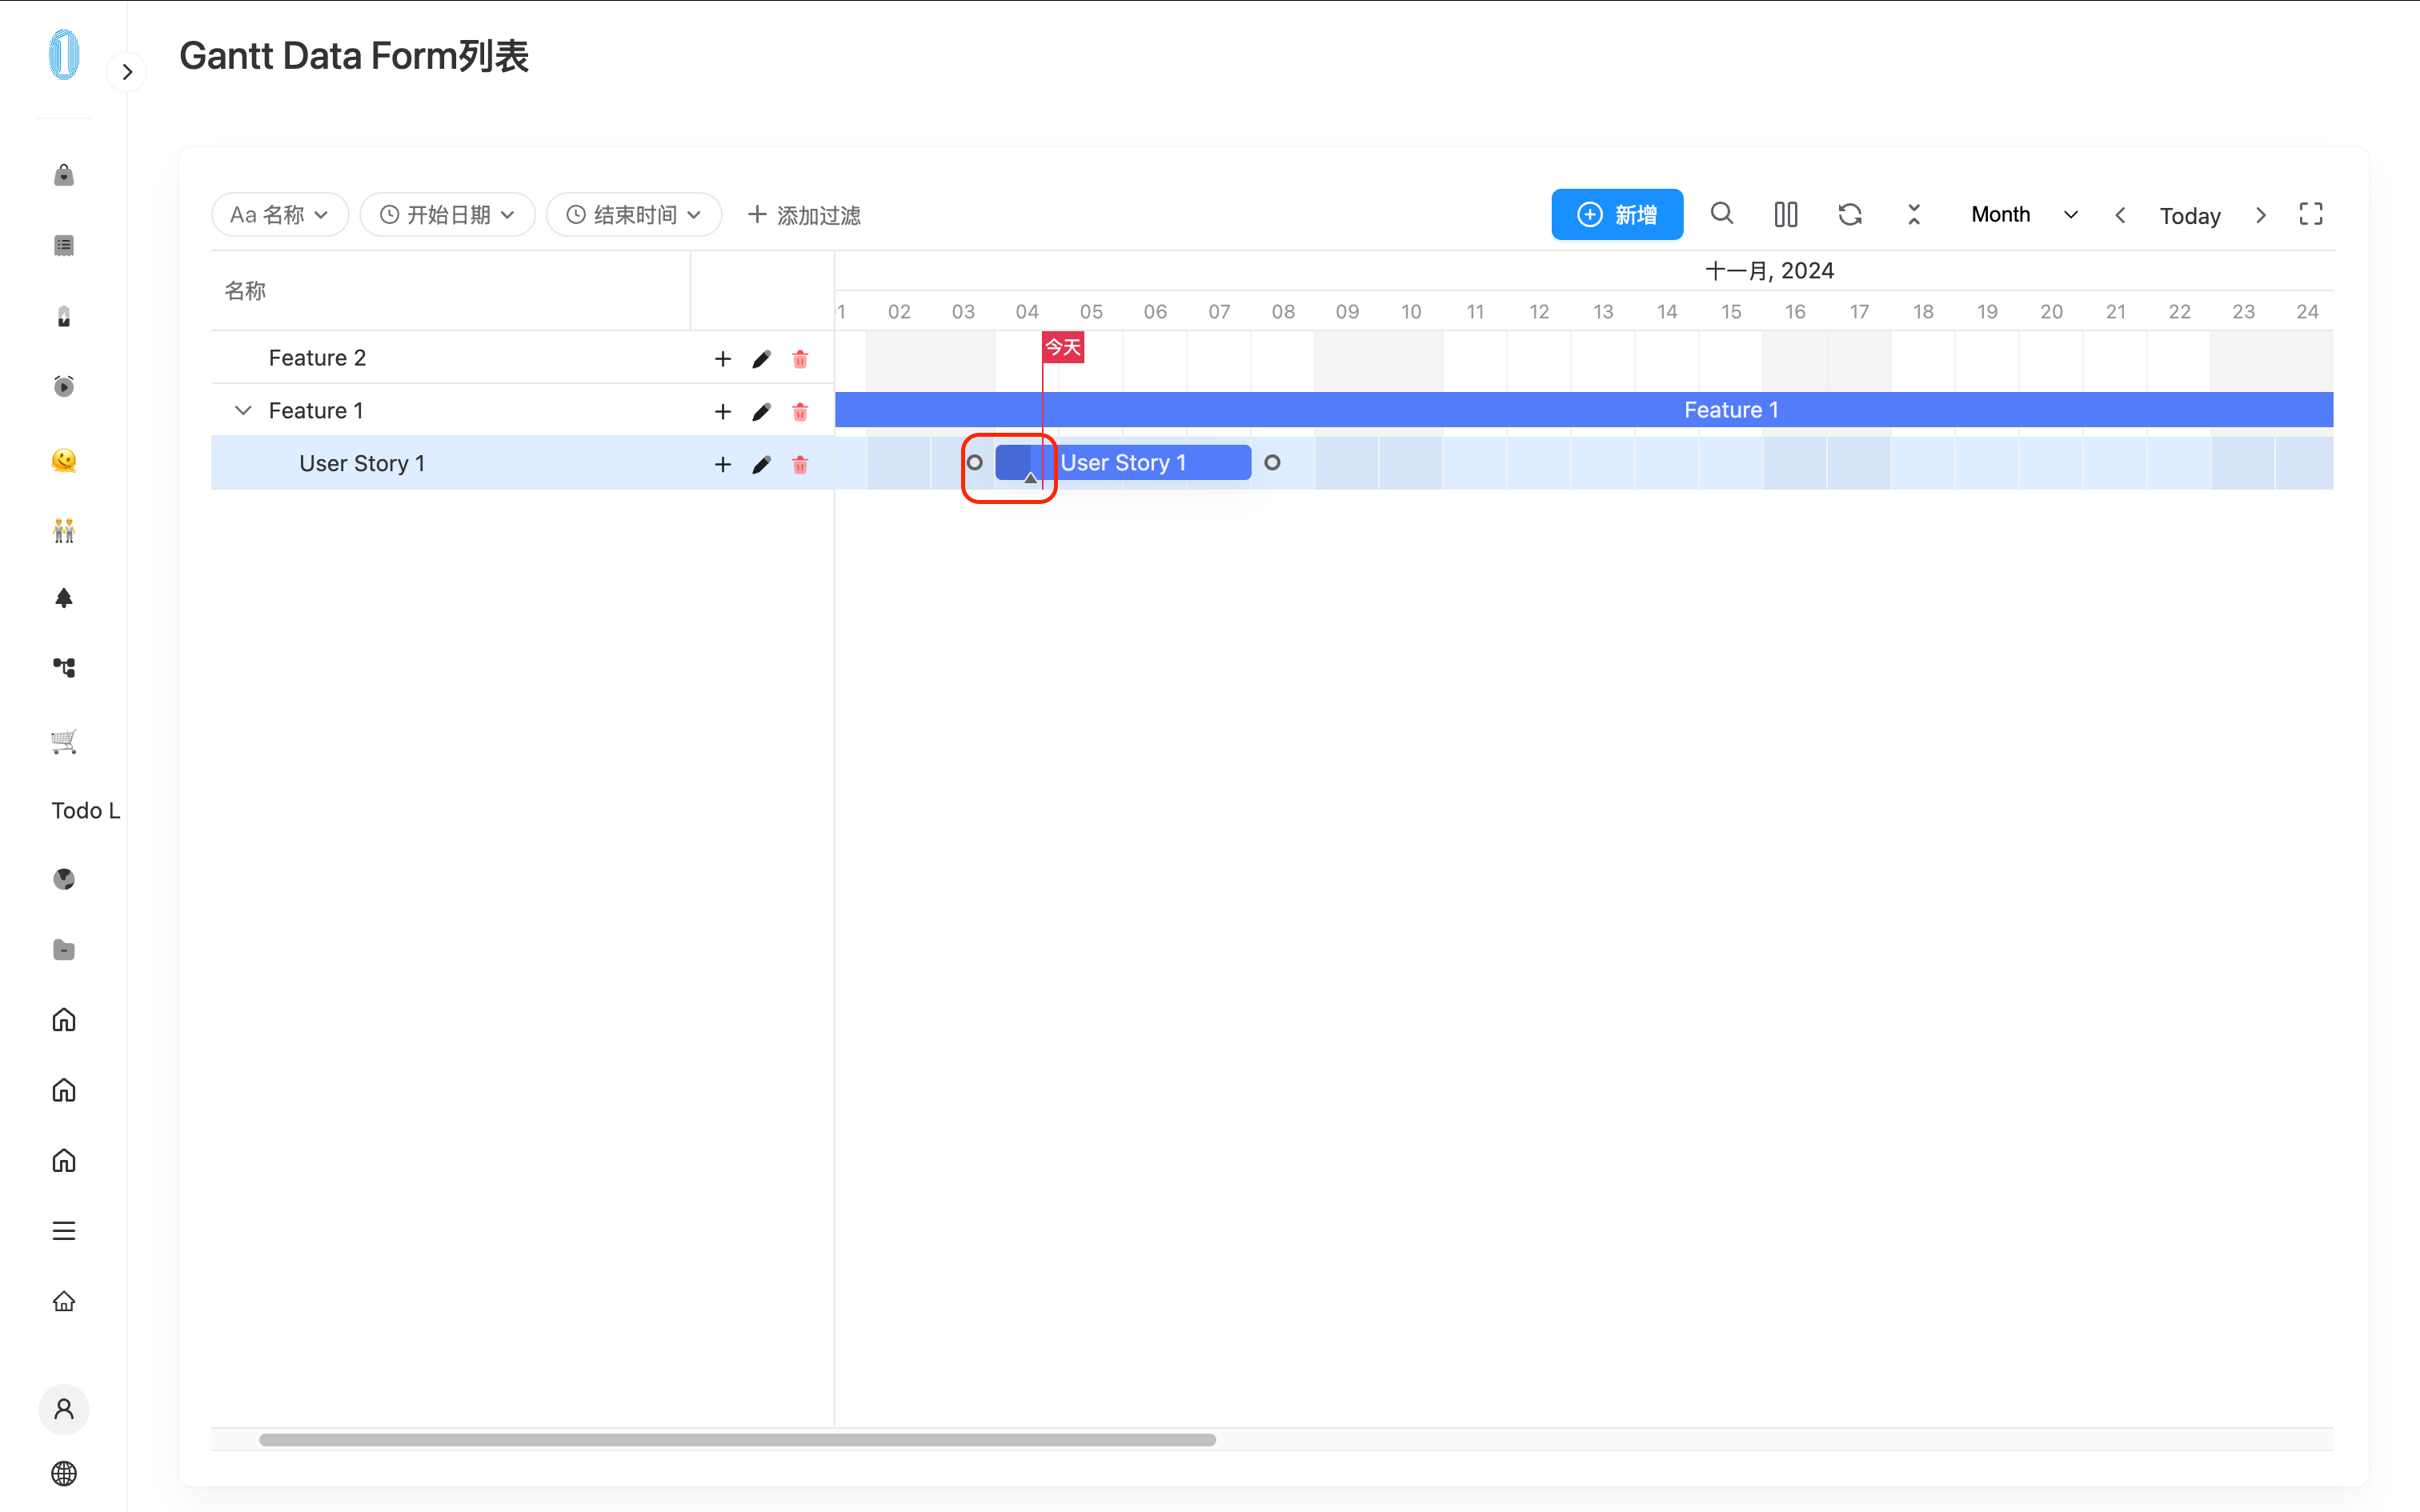
Now, when you visit the page and hover over a Gantt bar, you will see a small triangle on the left side of each task that allows you to drag and adjust the task's progress.
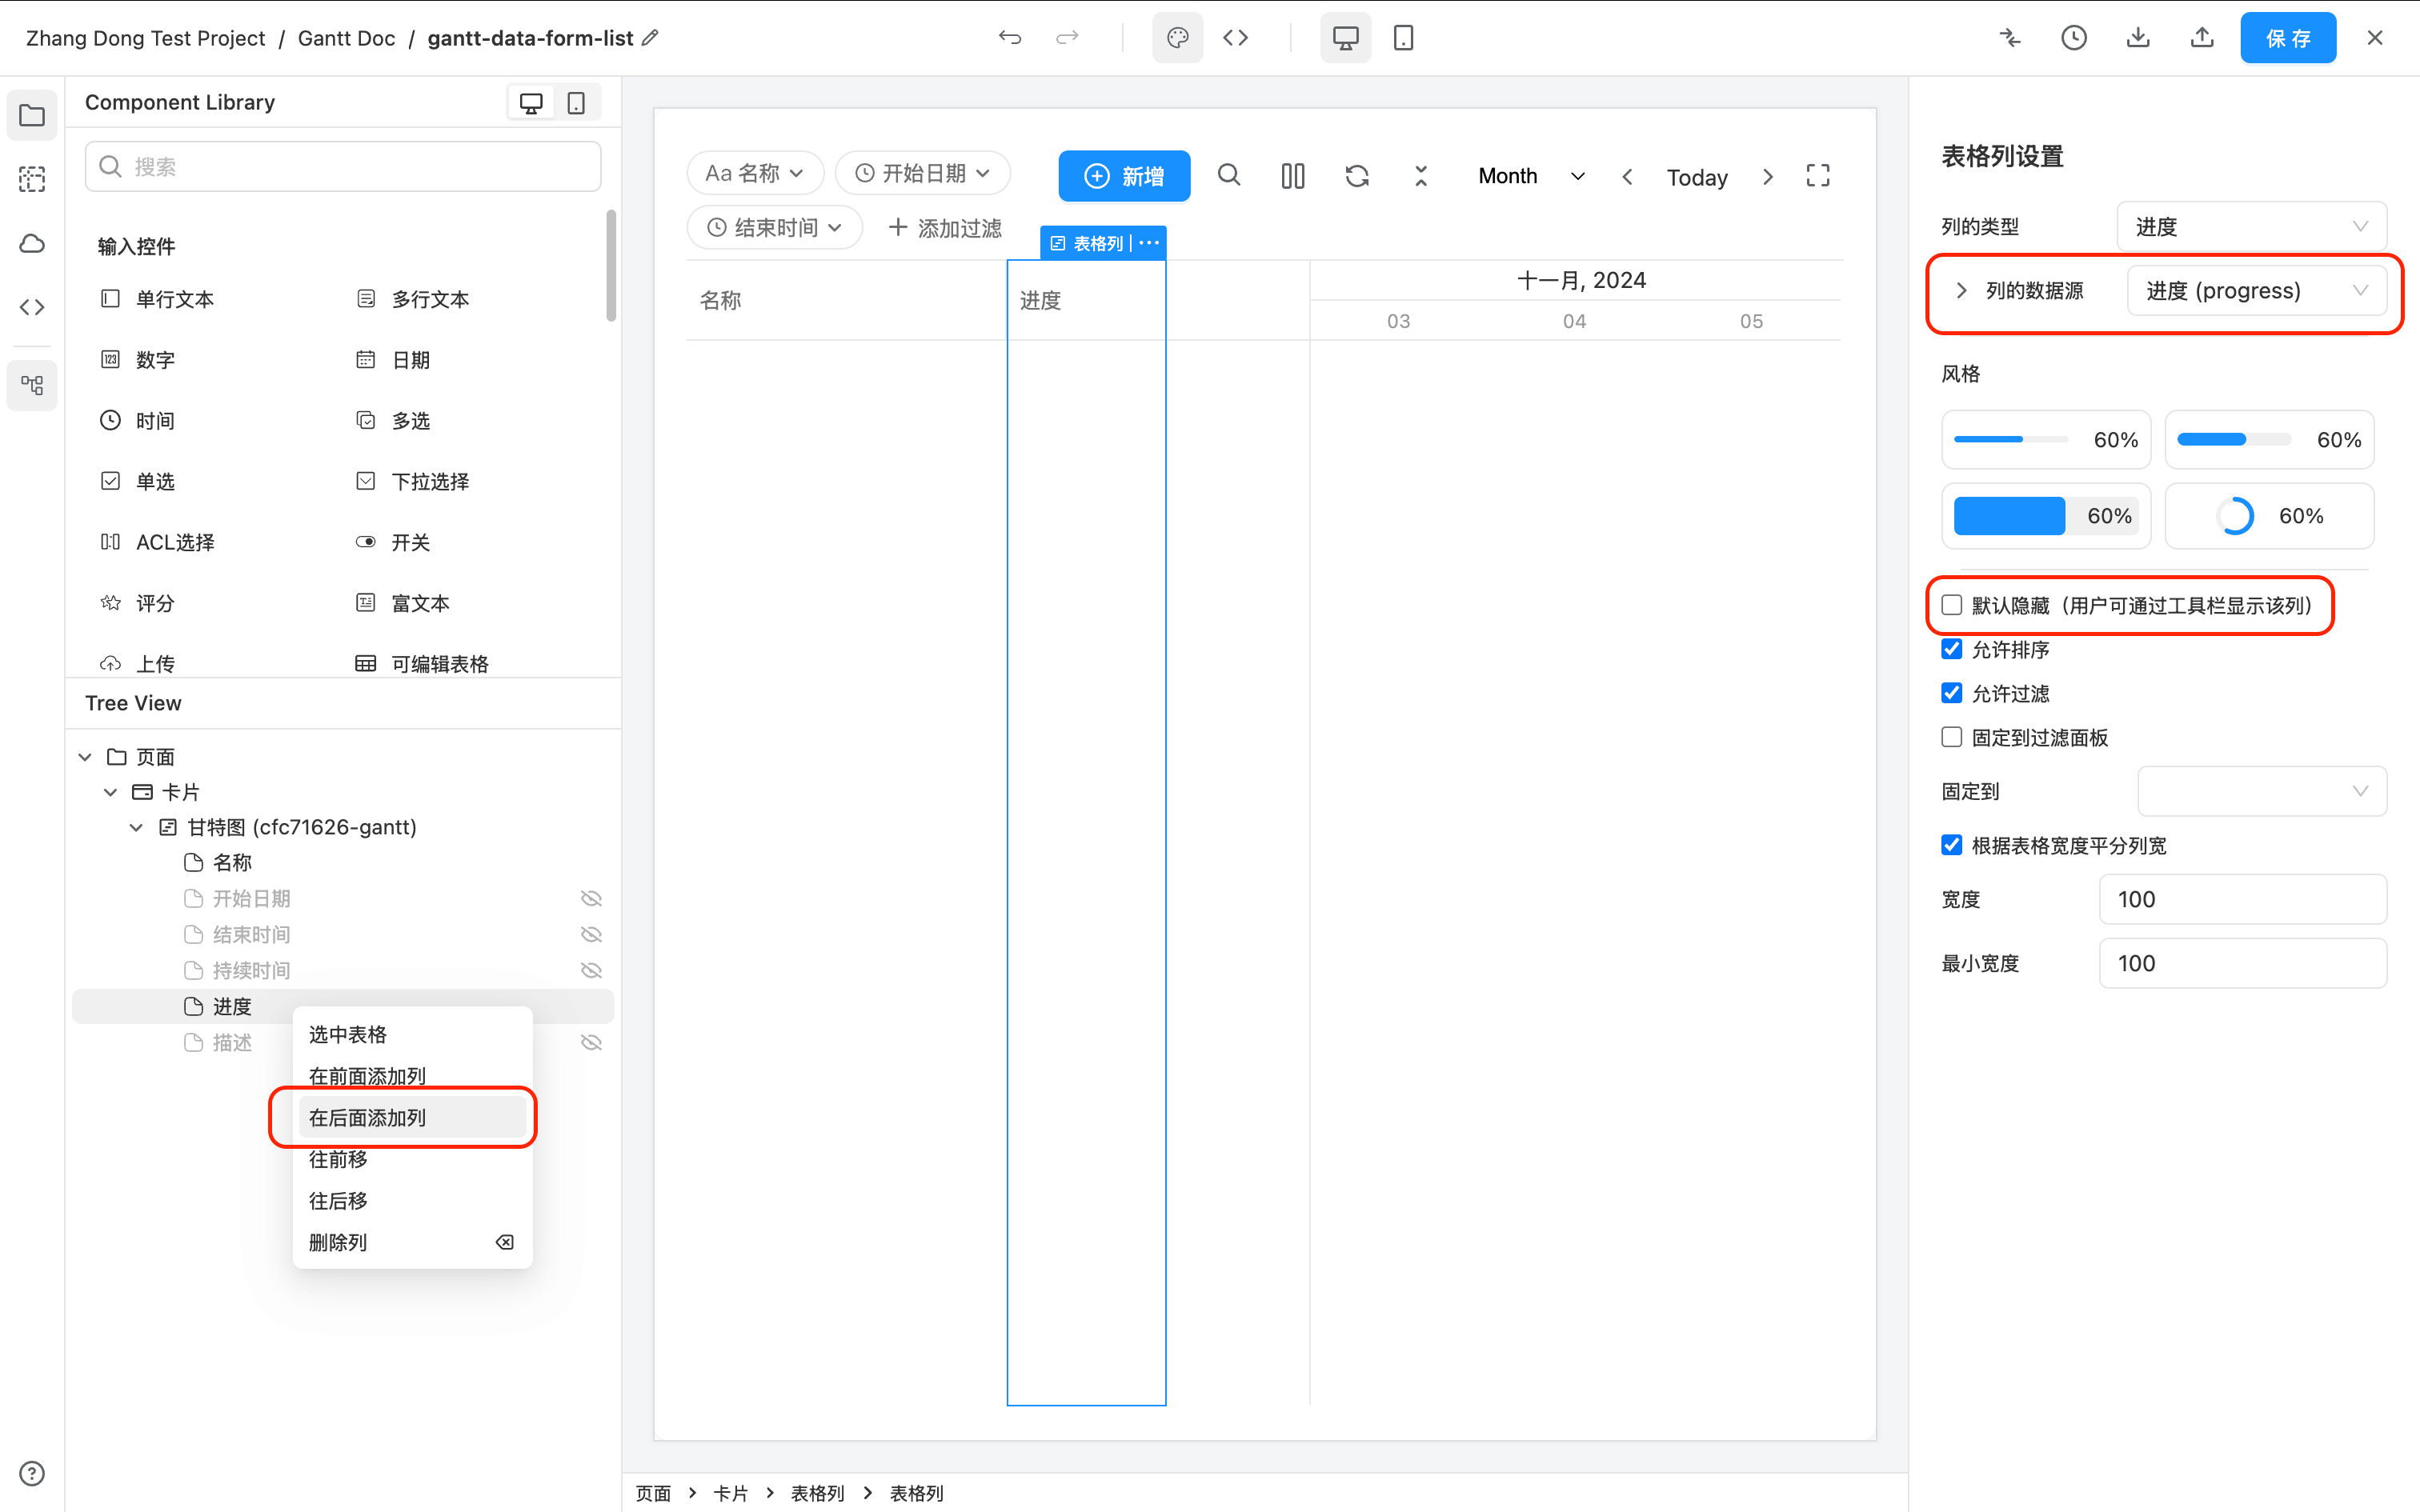
If you want to display the progress in the table on the left side of the Gantt Chart, you can add this column to the display in the Gantt component settings.
Supporting Milestones
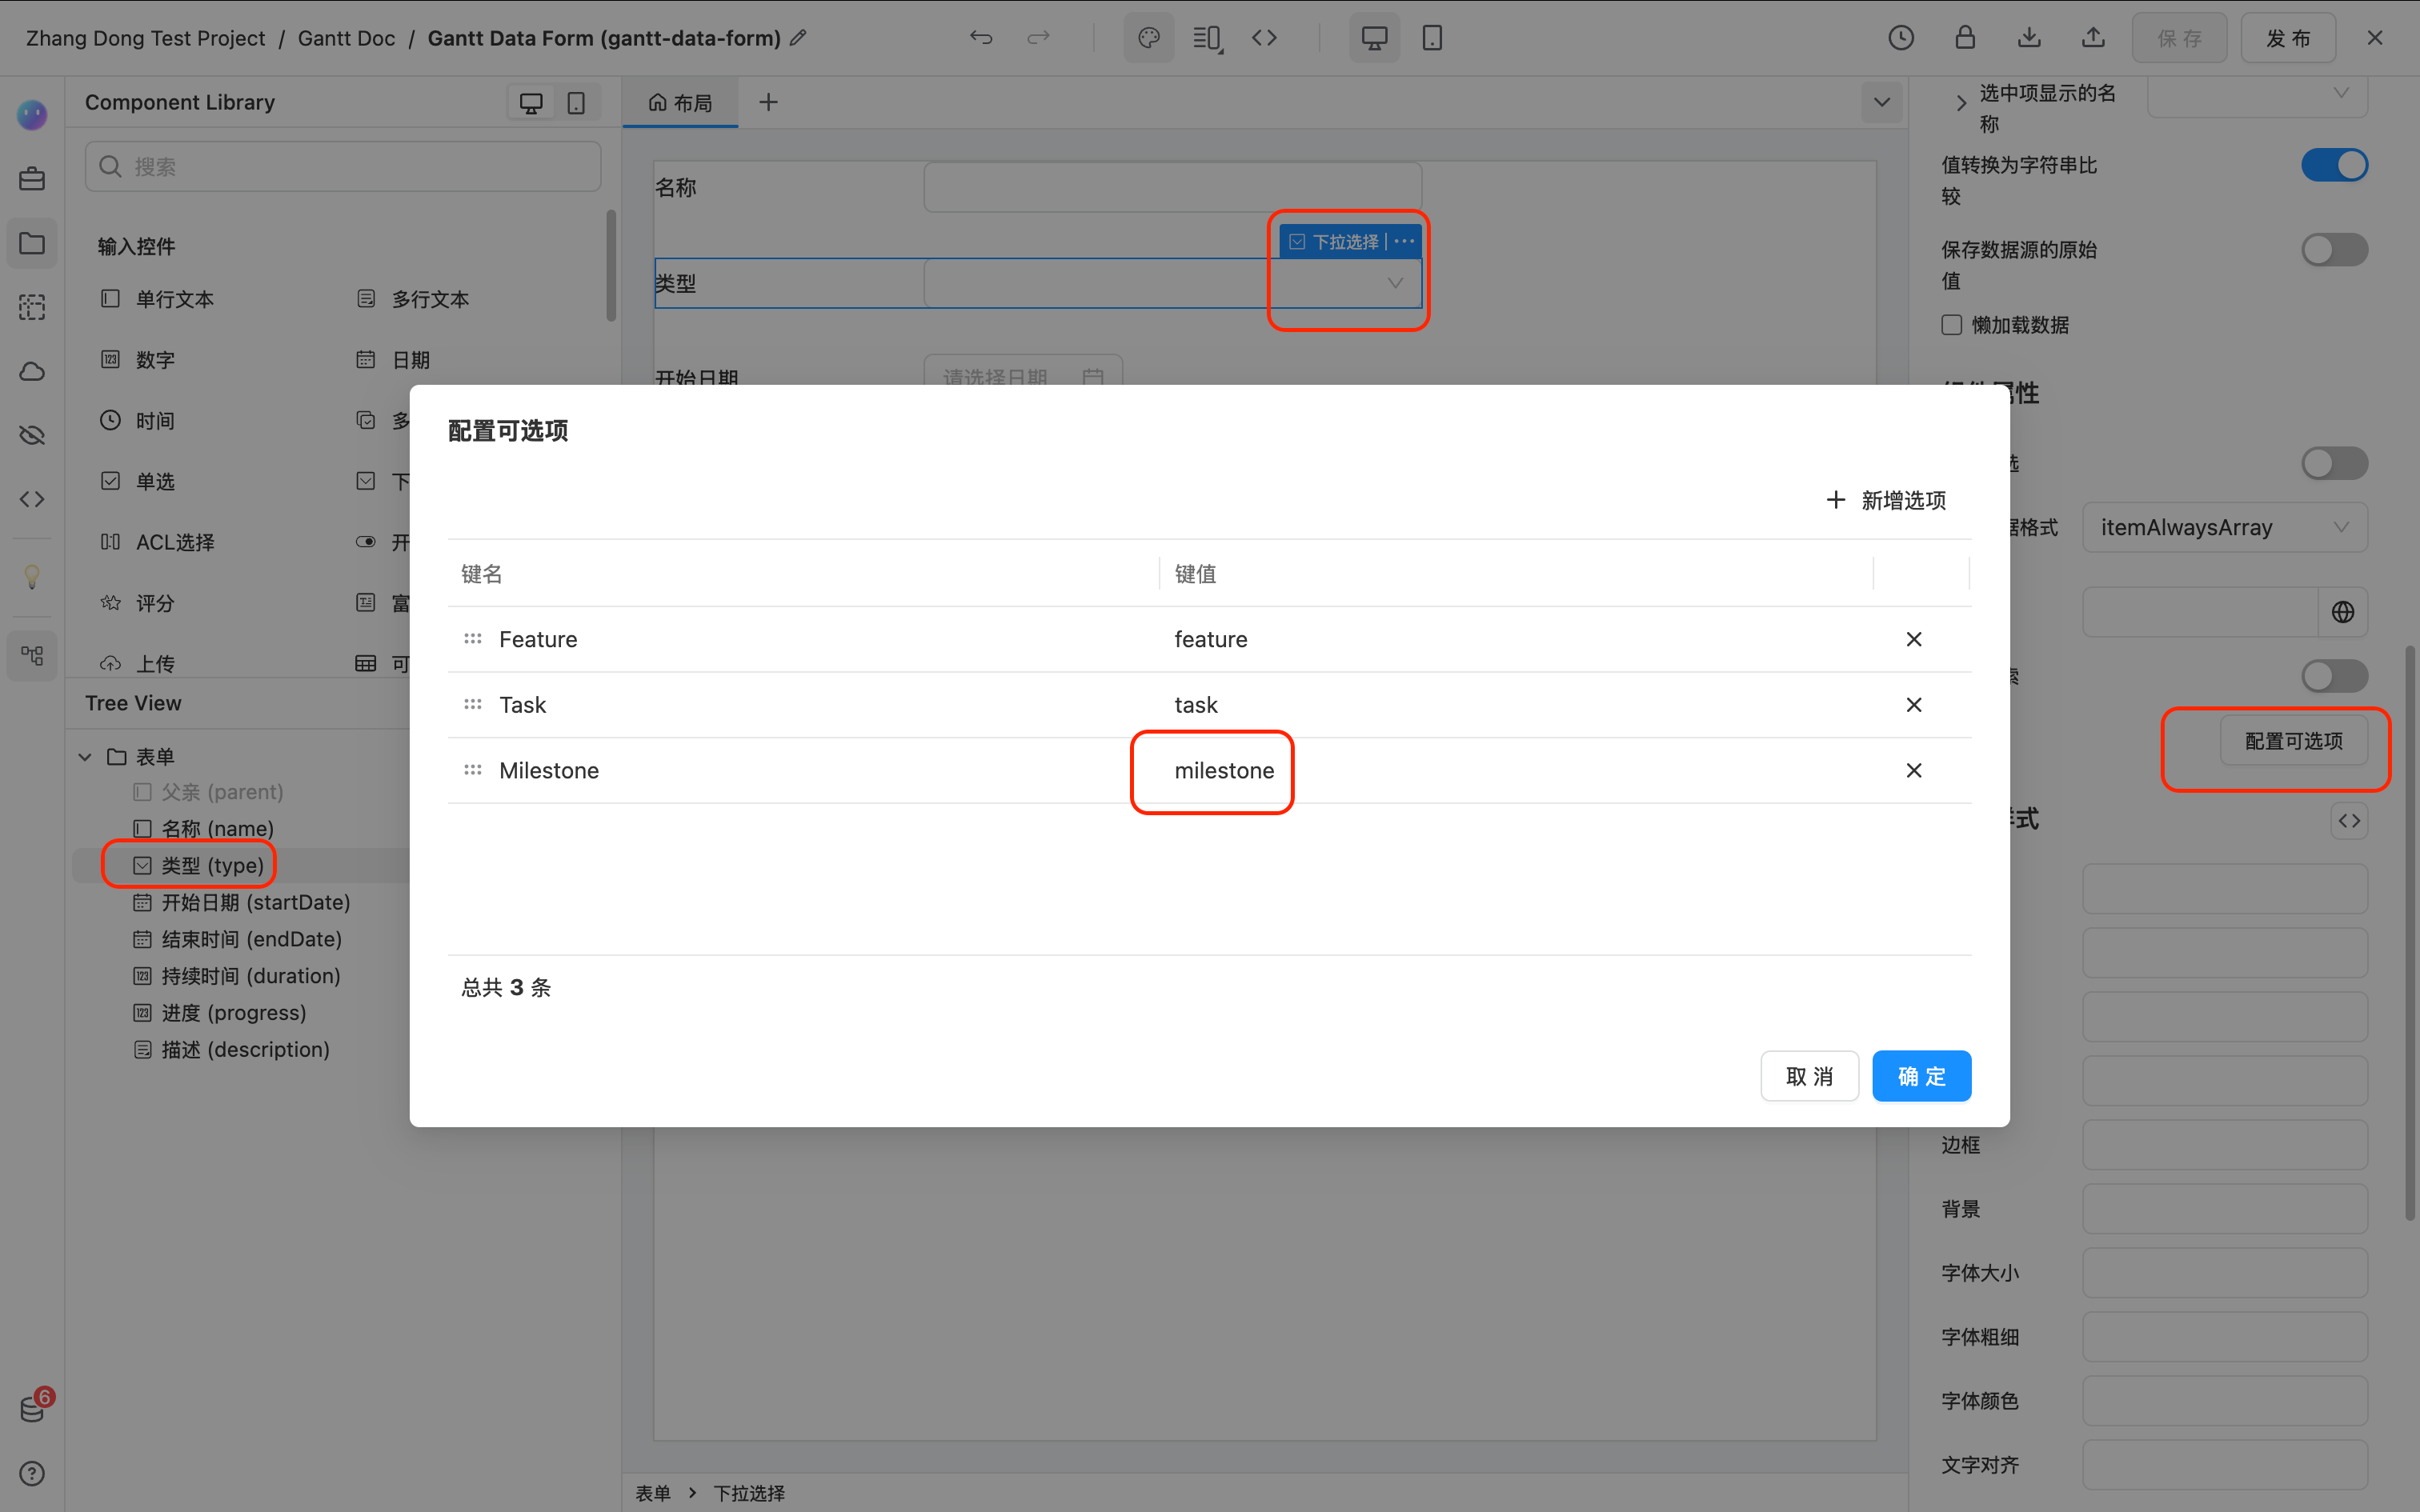
To support Milestones, you need to add a dropdown selection component in the data source. The options must include a value with the type milestone, and other options can be arbitrary. The field ID is not required and can be named according to your project needs.
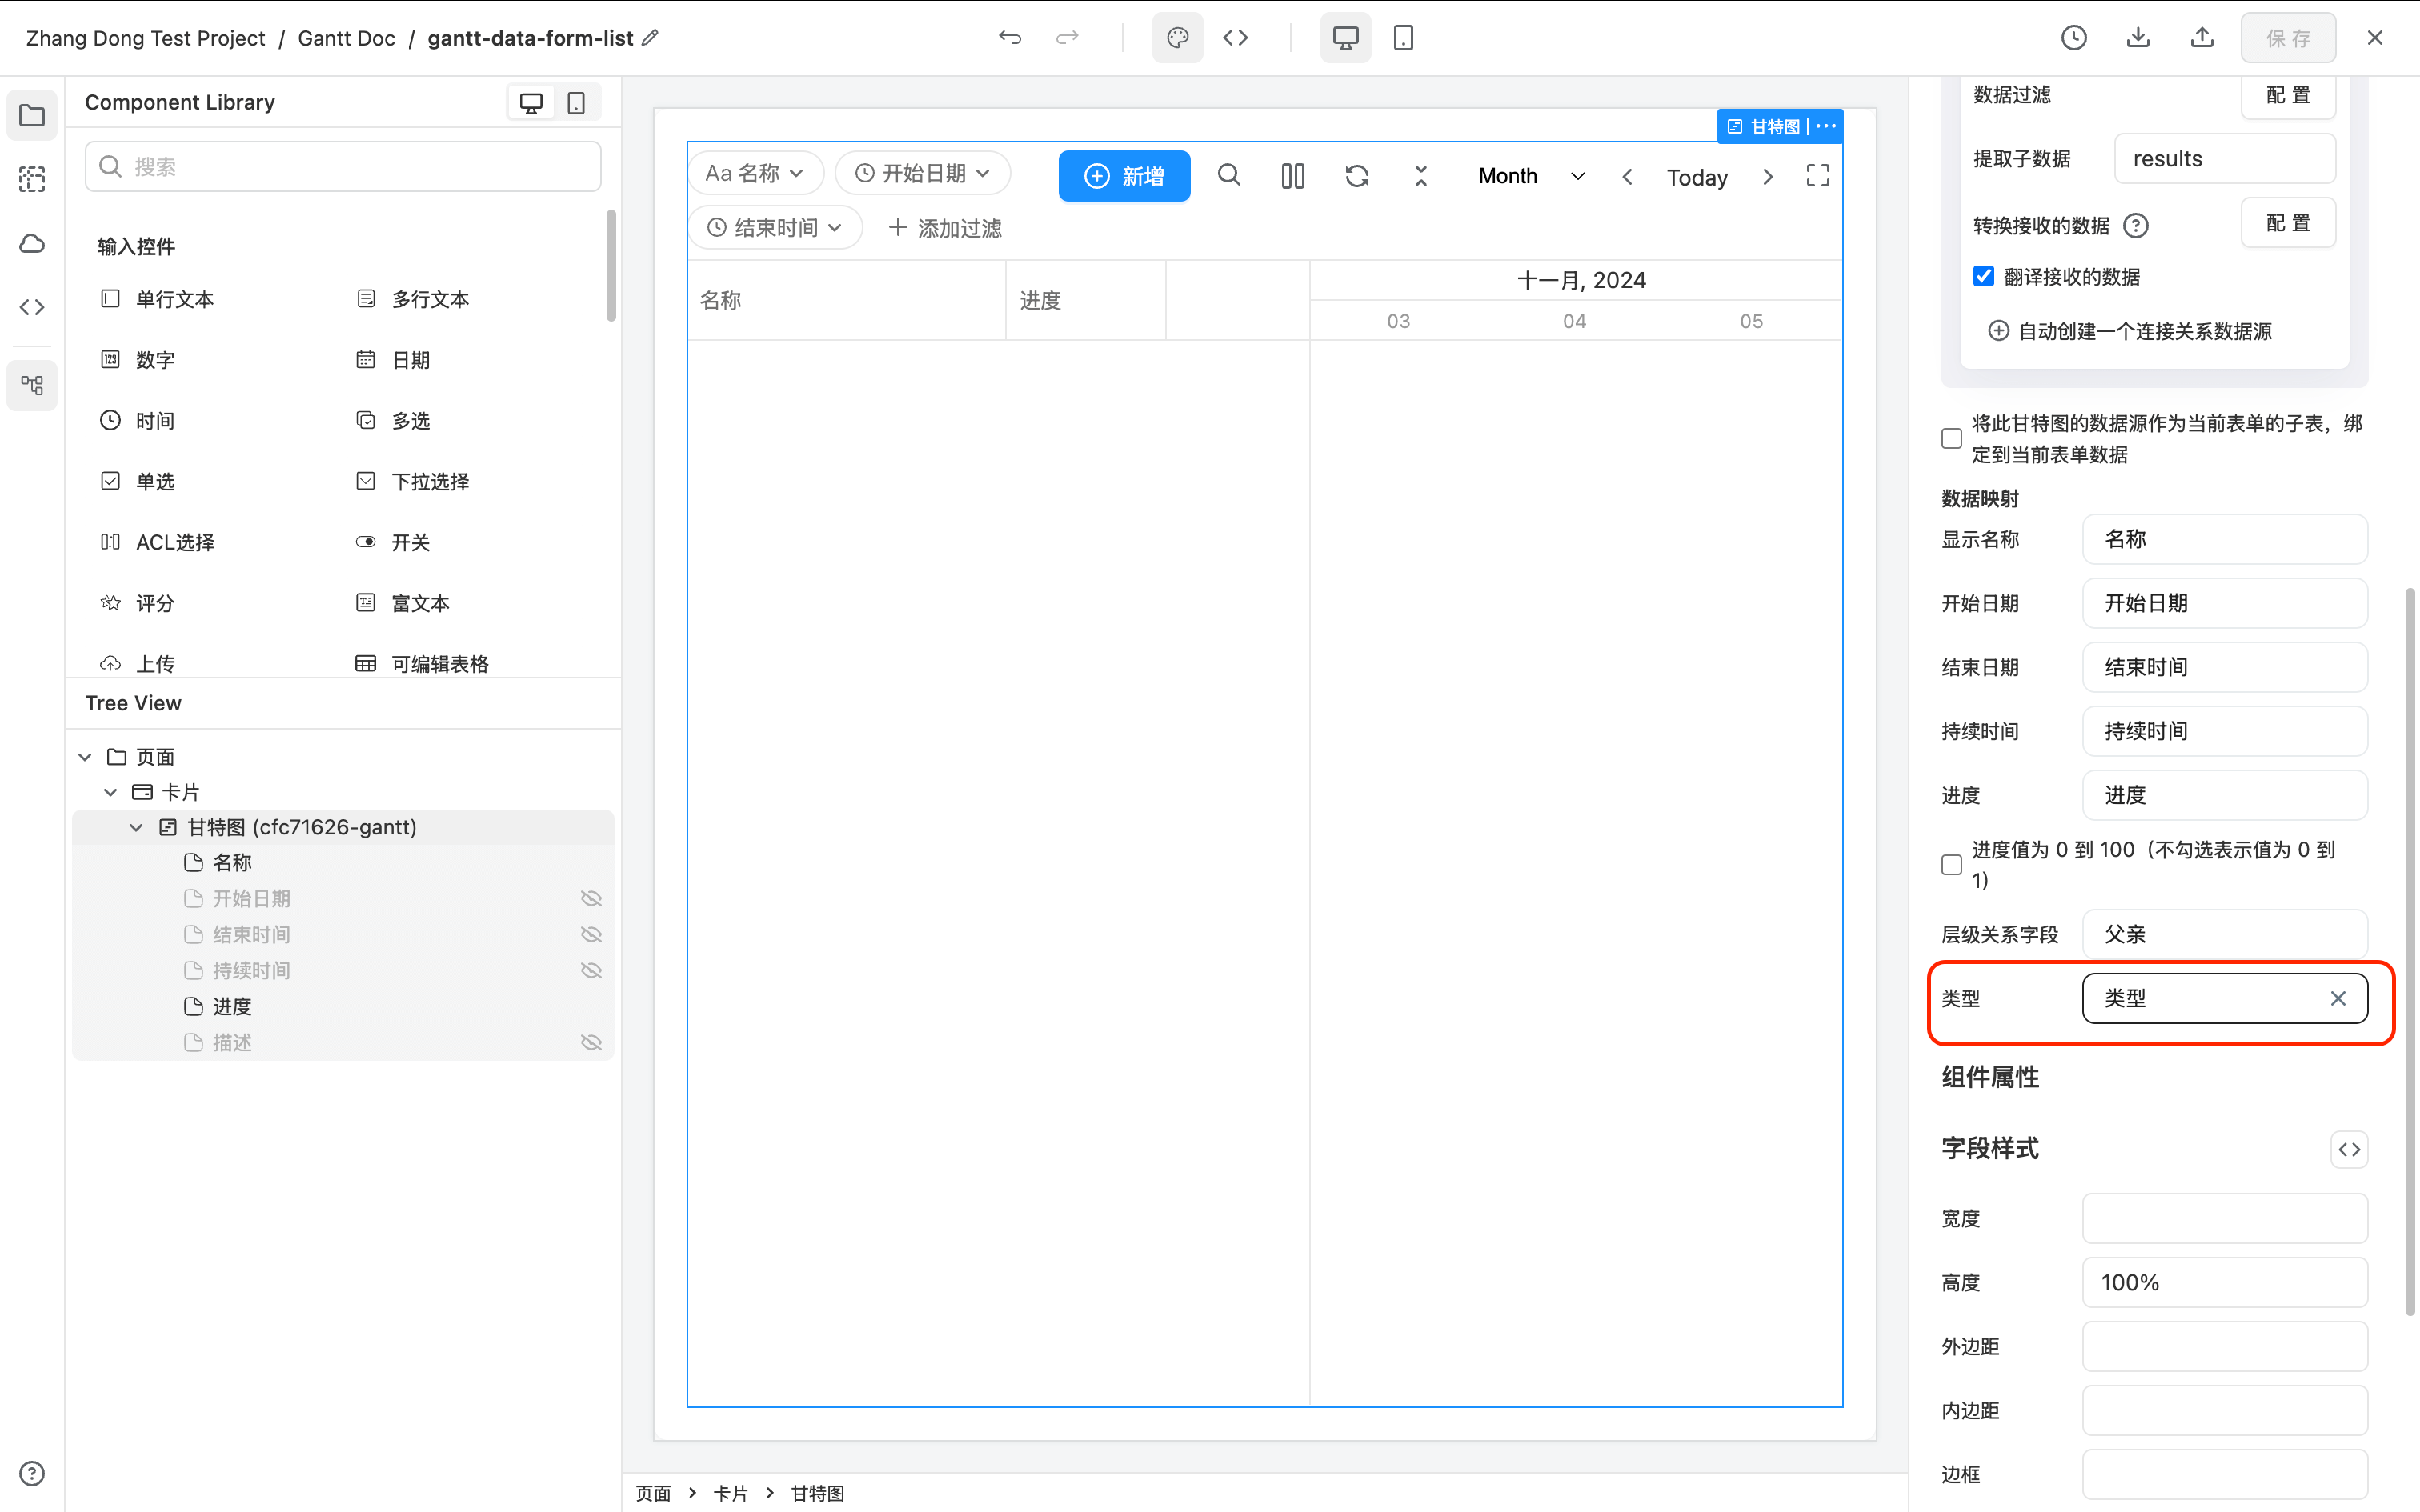
At the same time, in the Gantt component settings, select the added field as the "Type."
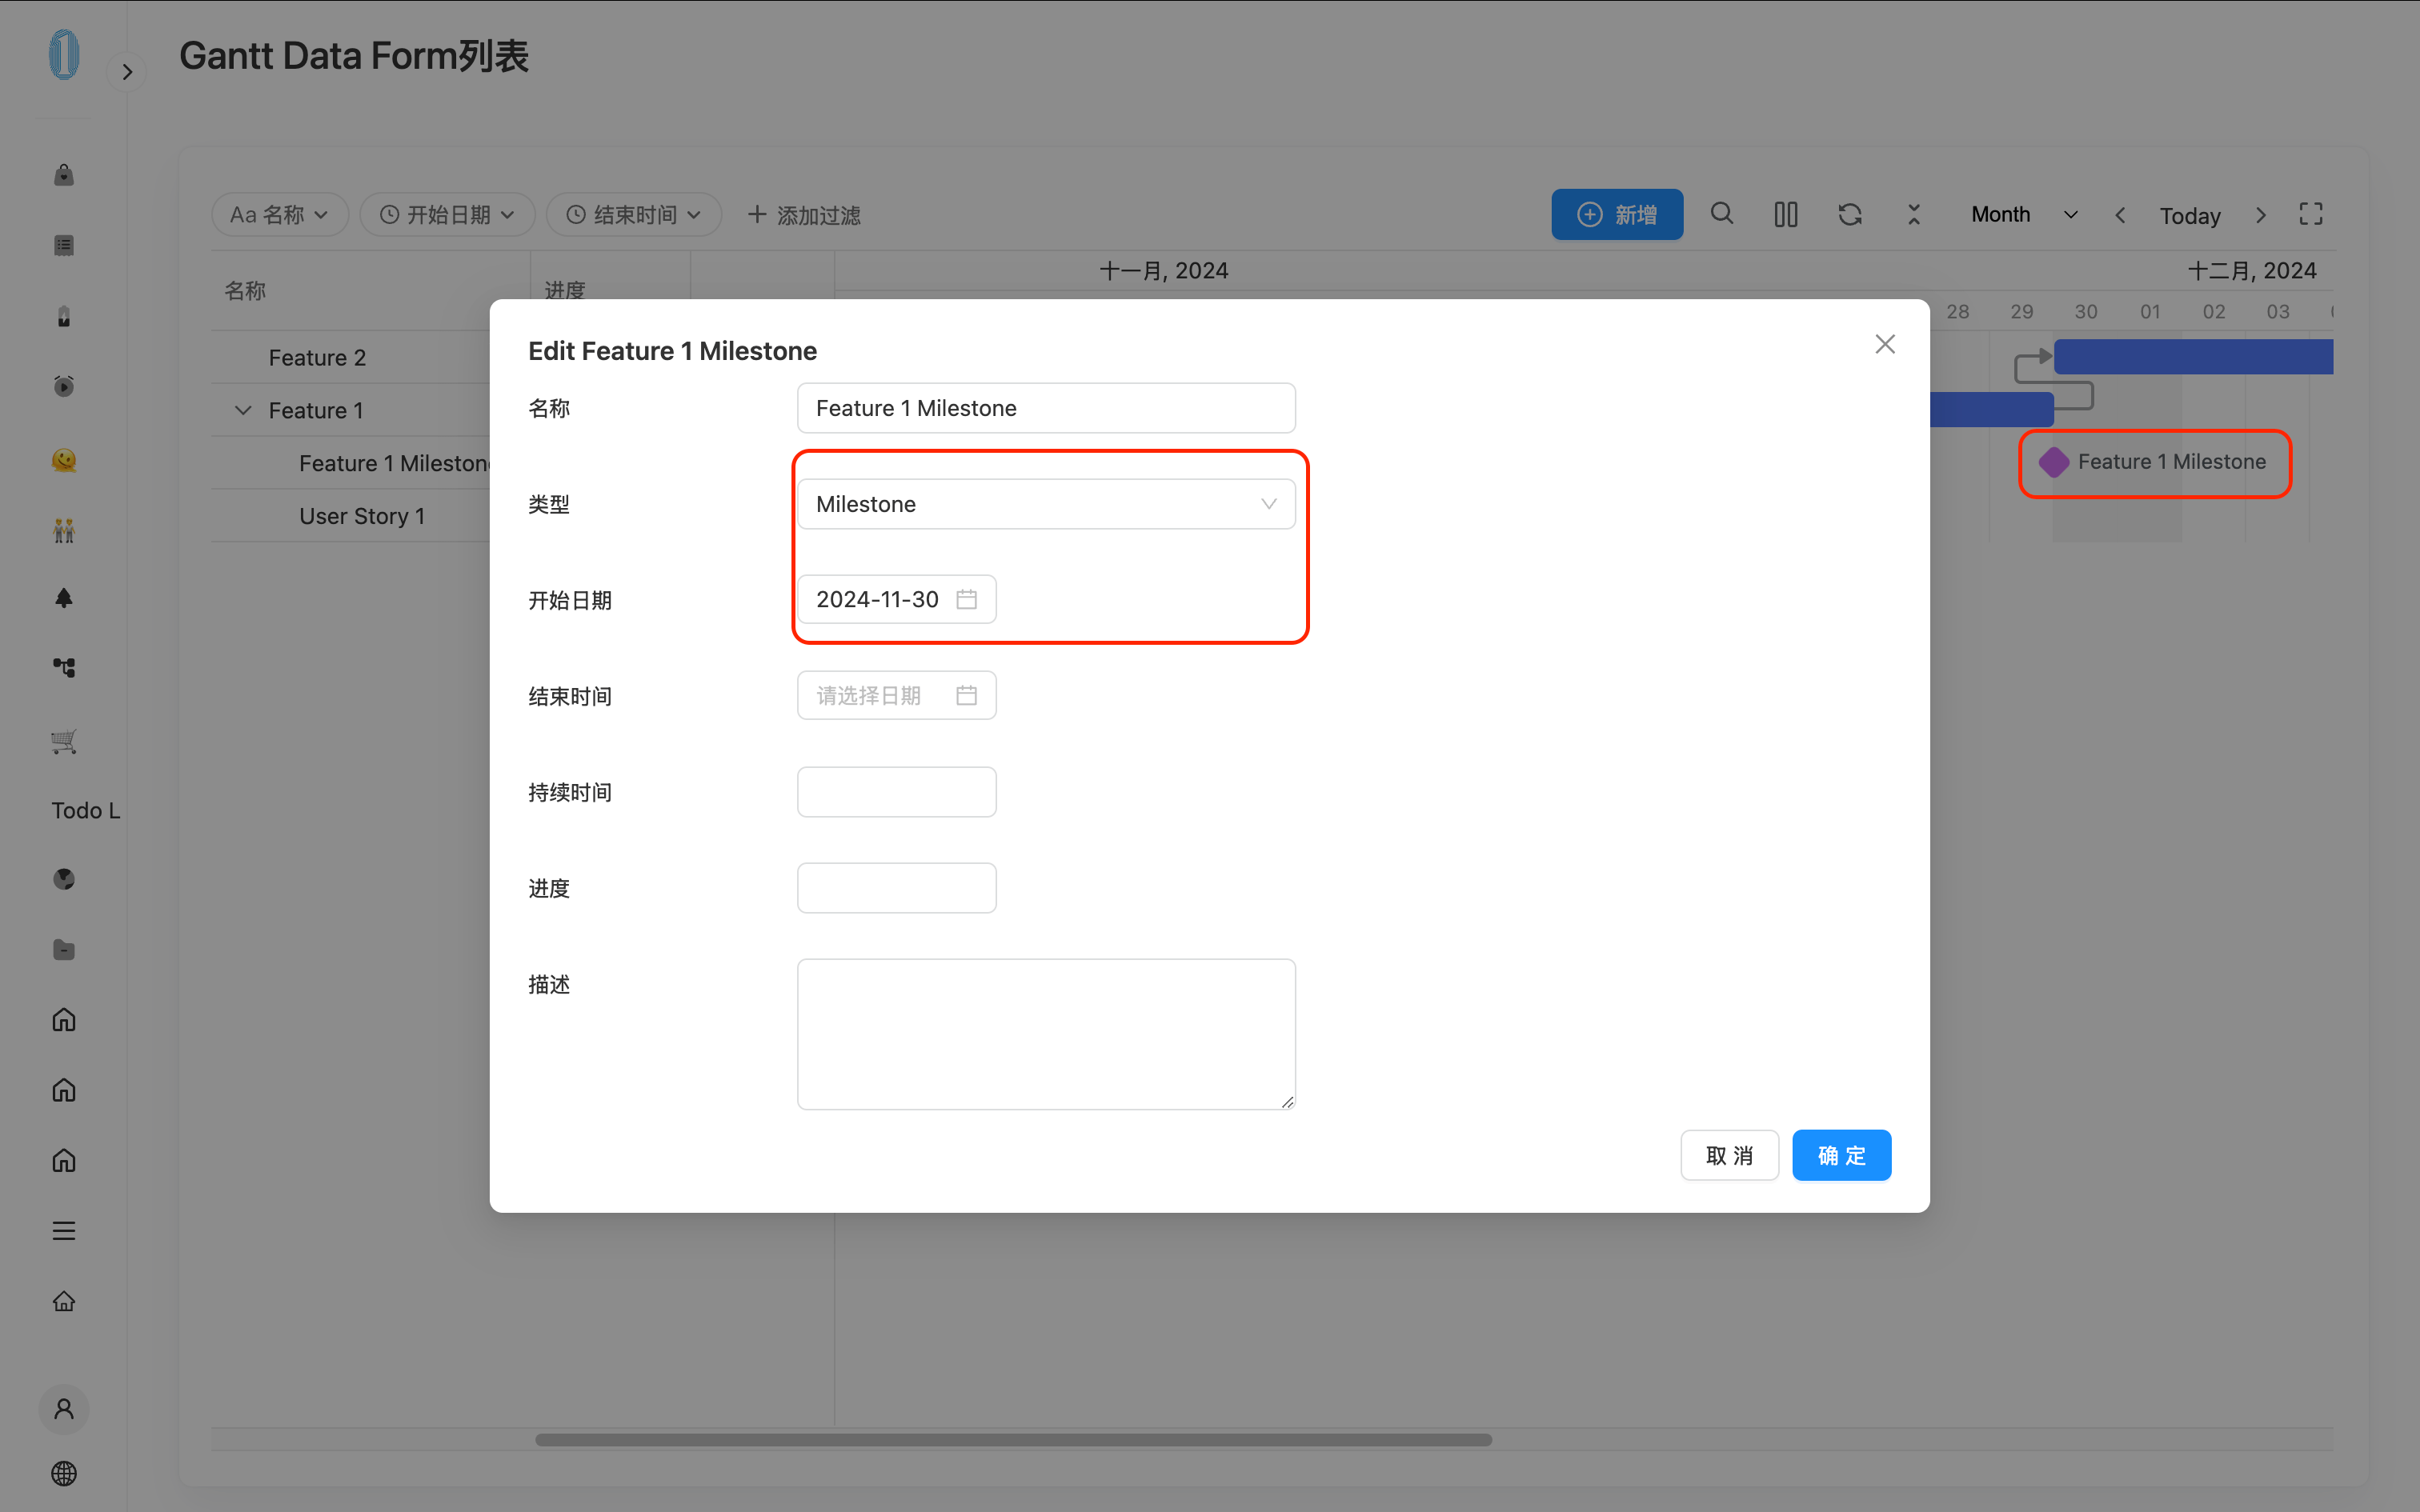
Now, when you visit the page and create a new task with the type set to "Milestone," the Gantt Chart will display the task in the Milestone style.
Using Gantt Data as a Sub-form of the Current Form (Similar to Editable Table)
To use the Gantt Chart data as a sub-form of the current form, simply enable the option "Treat this Gantt Chart's data source as a sub-form of the current form and bind it to the current form data" in both the Gantt settings and the "Automatically create connection relationship data source."
-
This operation requires that the Gantt Chart must be located within a form layout; otherwise, binding is not possible.
-
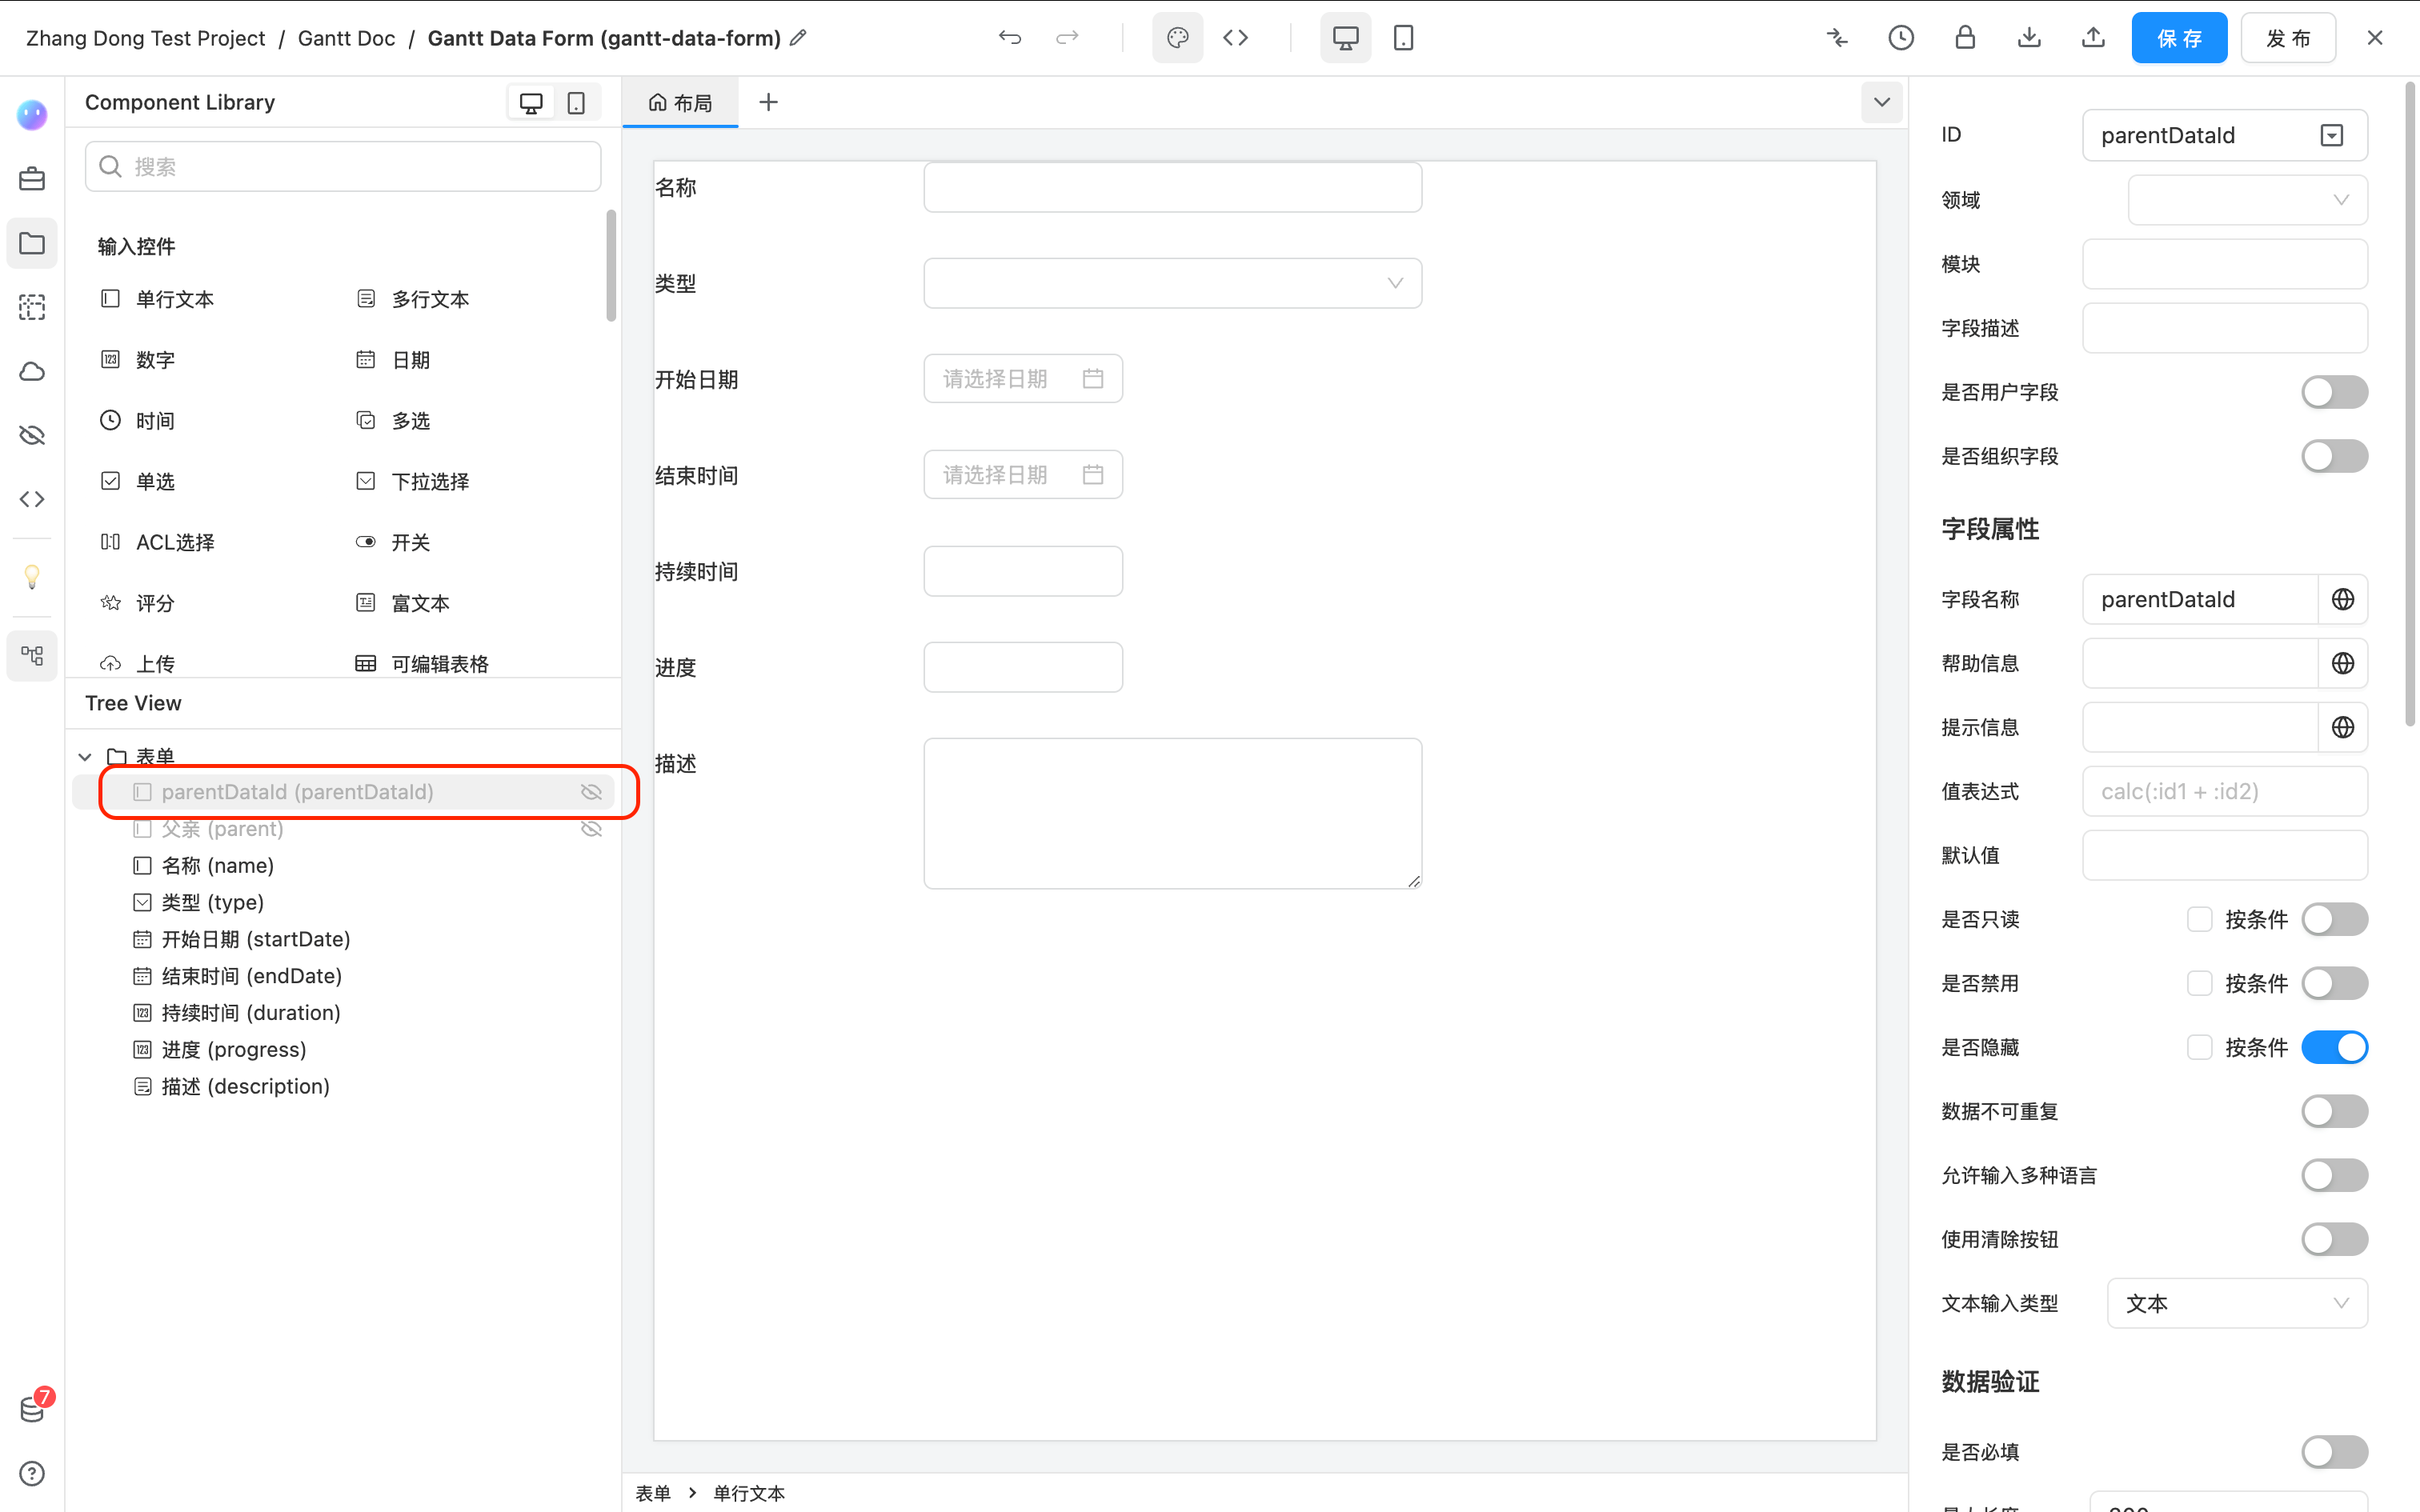
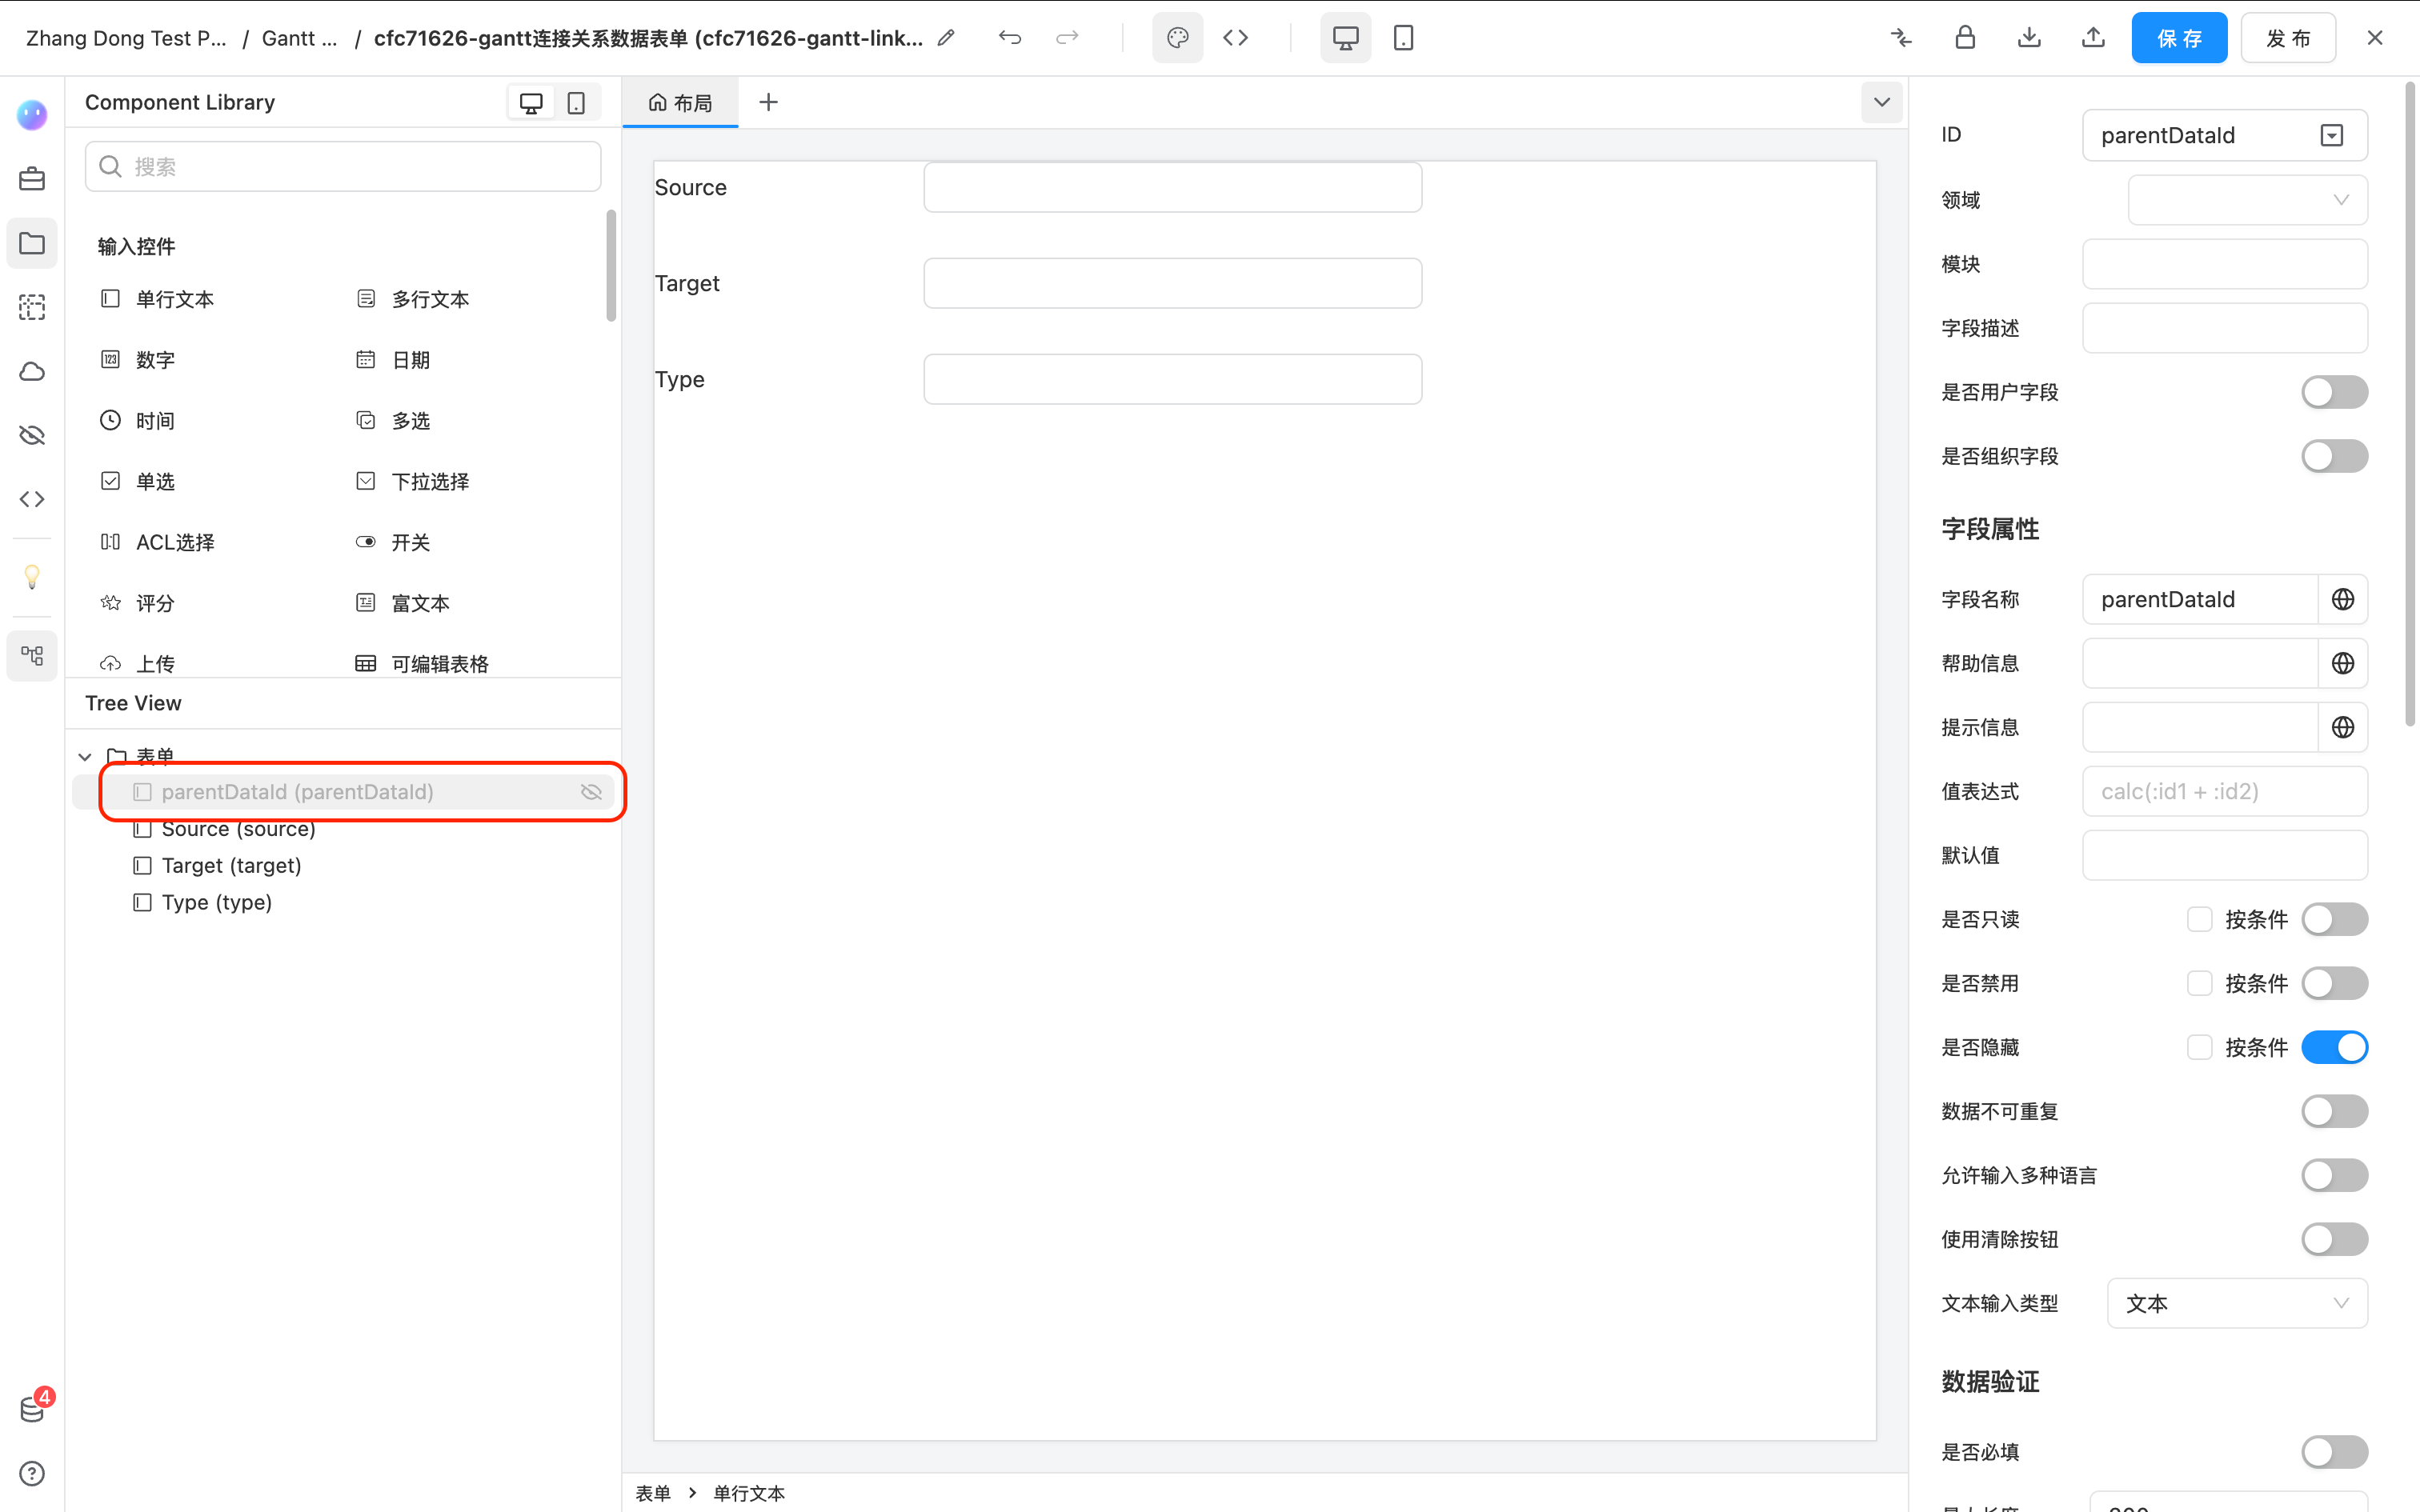
This operation requires that both the Gantt Chart's "data source" and "connection relationship data source" must have a
parentDataIdfield, which should be set to hidden. -
This operation requires that the Gantt Chart must be in the "Edit" layout of the form, meaning that the current form data must already exist. (This is because the Gantt data needs to be bound to the ID of the current form data, which only exists in edit mode)
Now, when you create a new form and add this Gantt Chart to the form's edit layout, each form data entry will have its own Gantt Chart data without affecting others.
Customizing Working Calendar
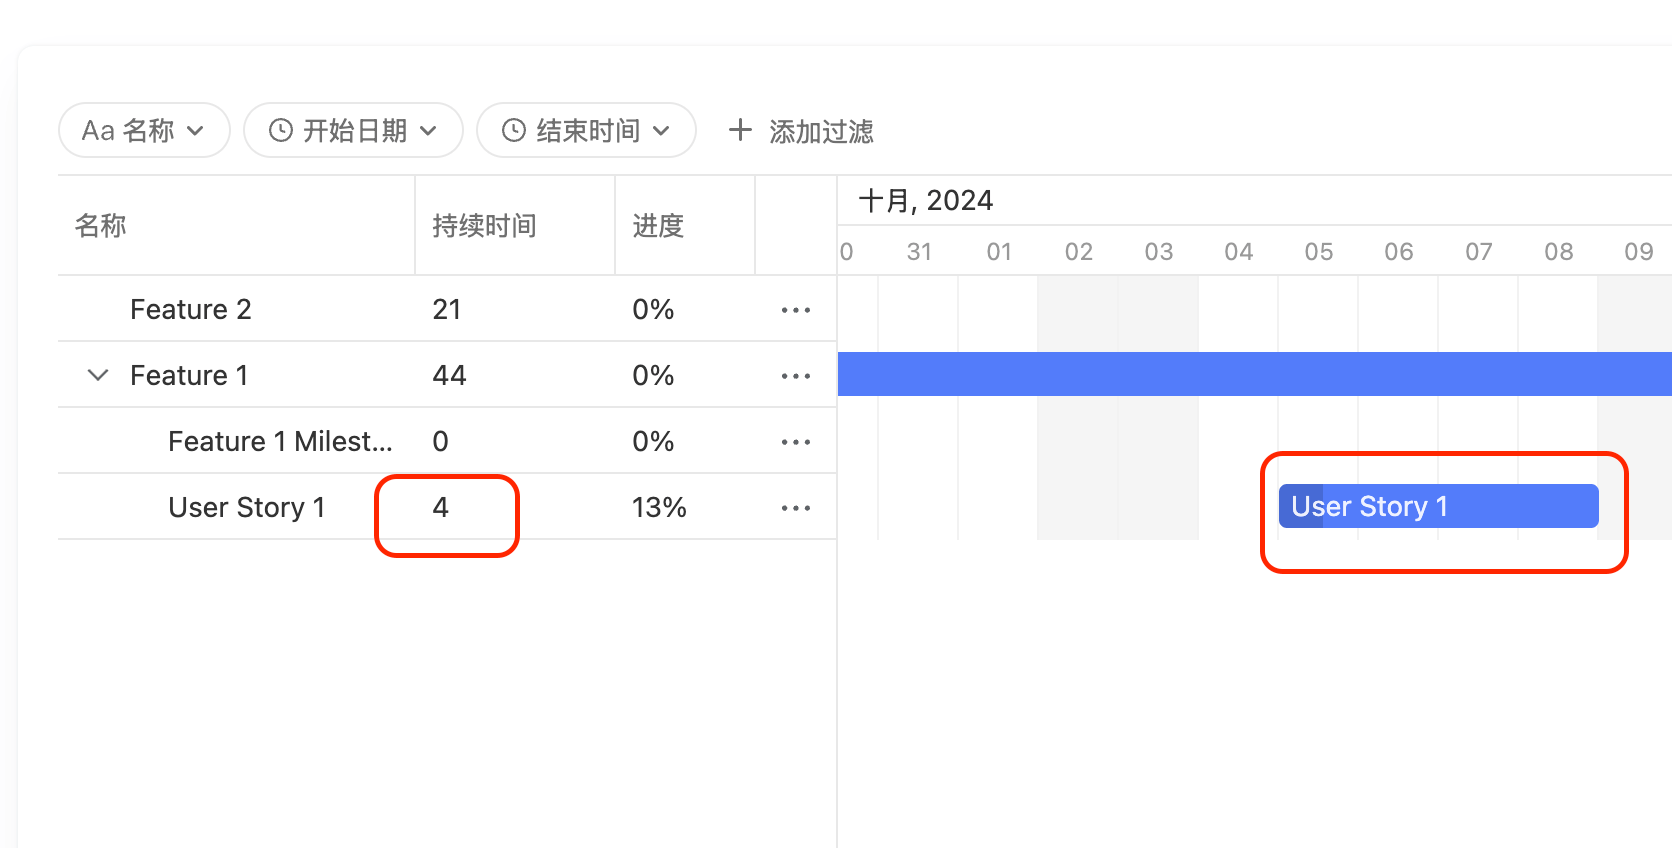
By default, the Gantt Chart automatically uses a working calendar from Monday to Friday, with Saturday and Sunday displayed in gray and excluded from duration calculations.
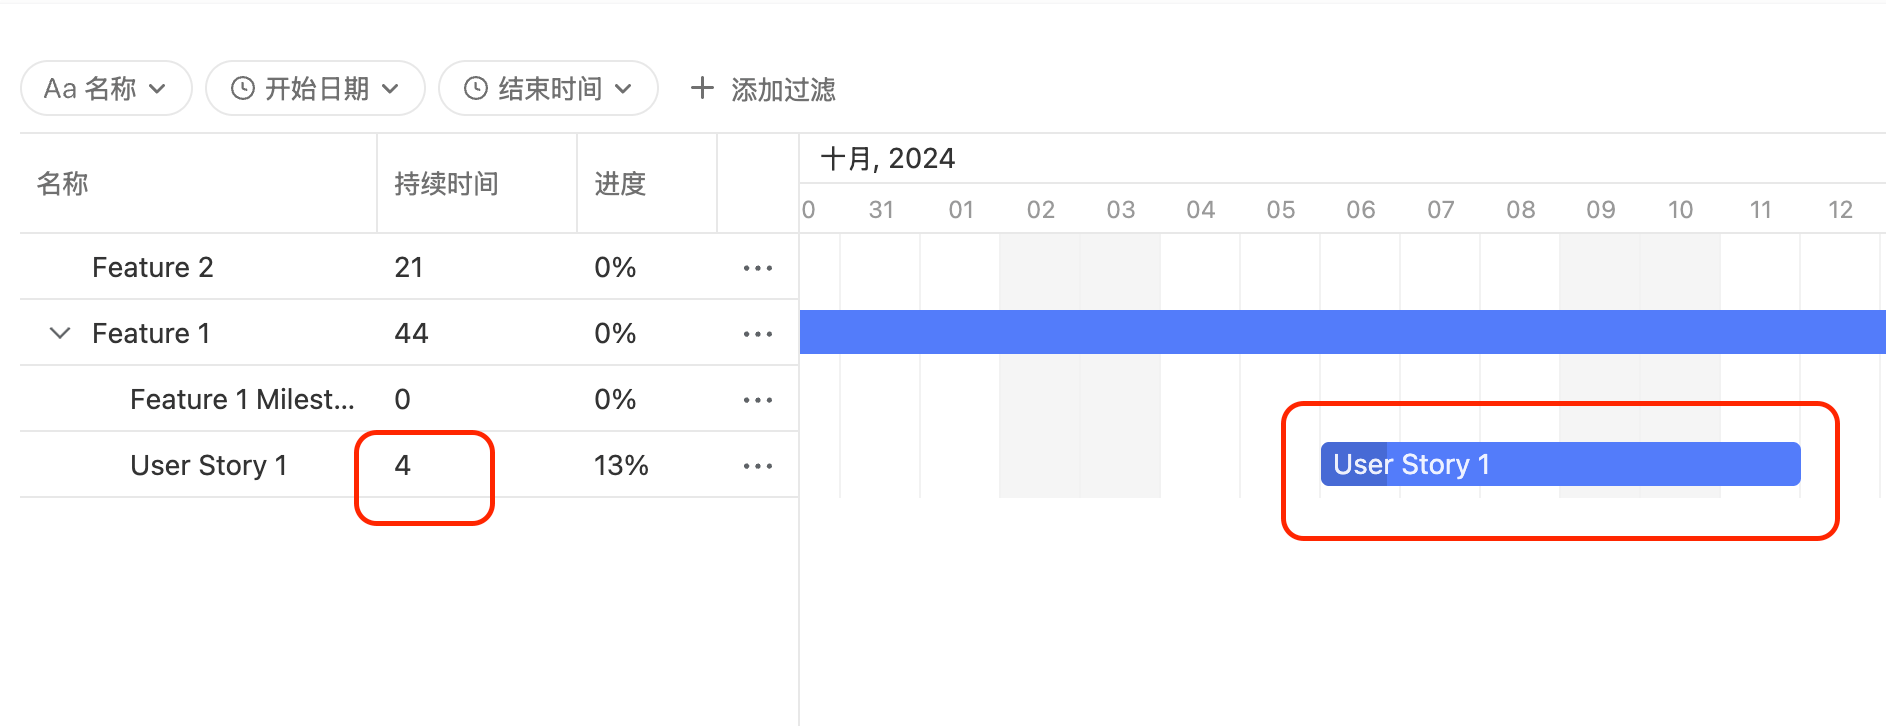
For example, the task "User Story 1" starts on October 5, 2024, with a duration of 4 days:
When you drag the task to start on October 6, 2024, the Gantt Chart automatically skips the weekend (October 9 and 10), and the duration remains 4 days:
If you want to disable this feature and not automatically skip weekends, you can uncheck the following Checkbox.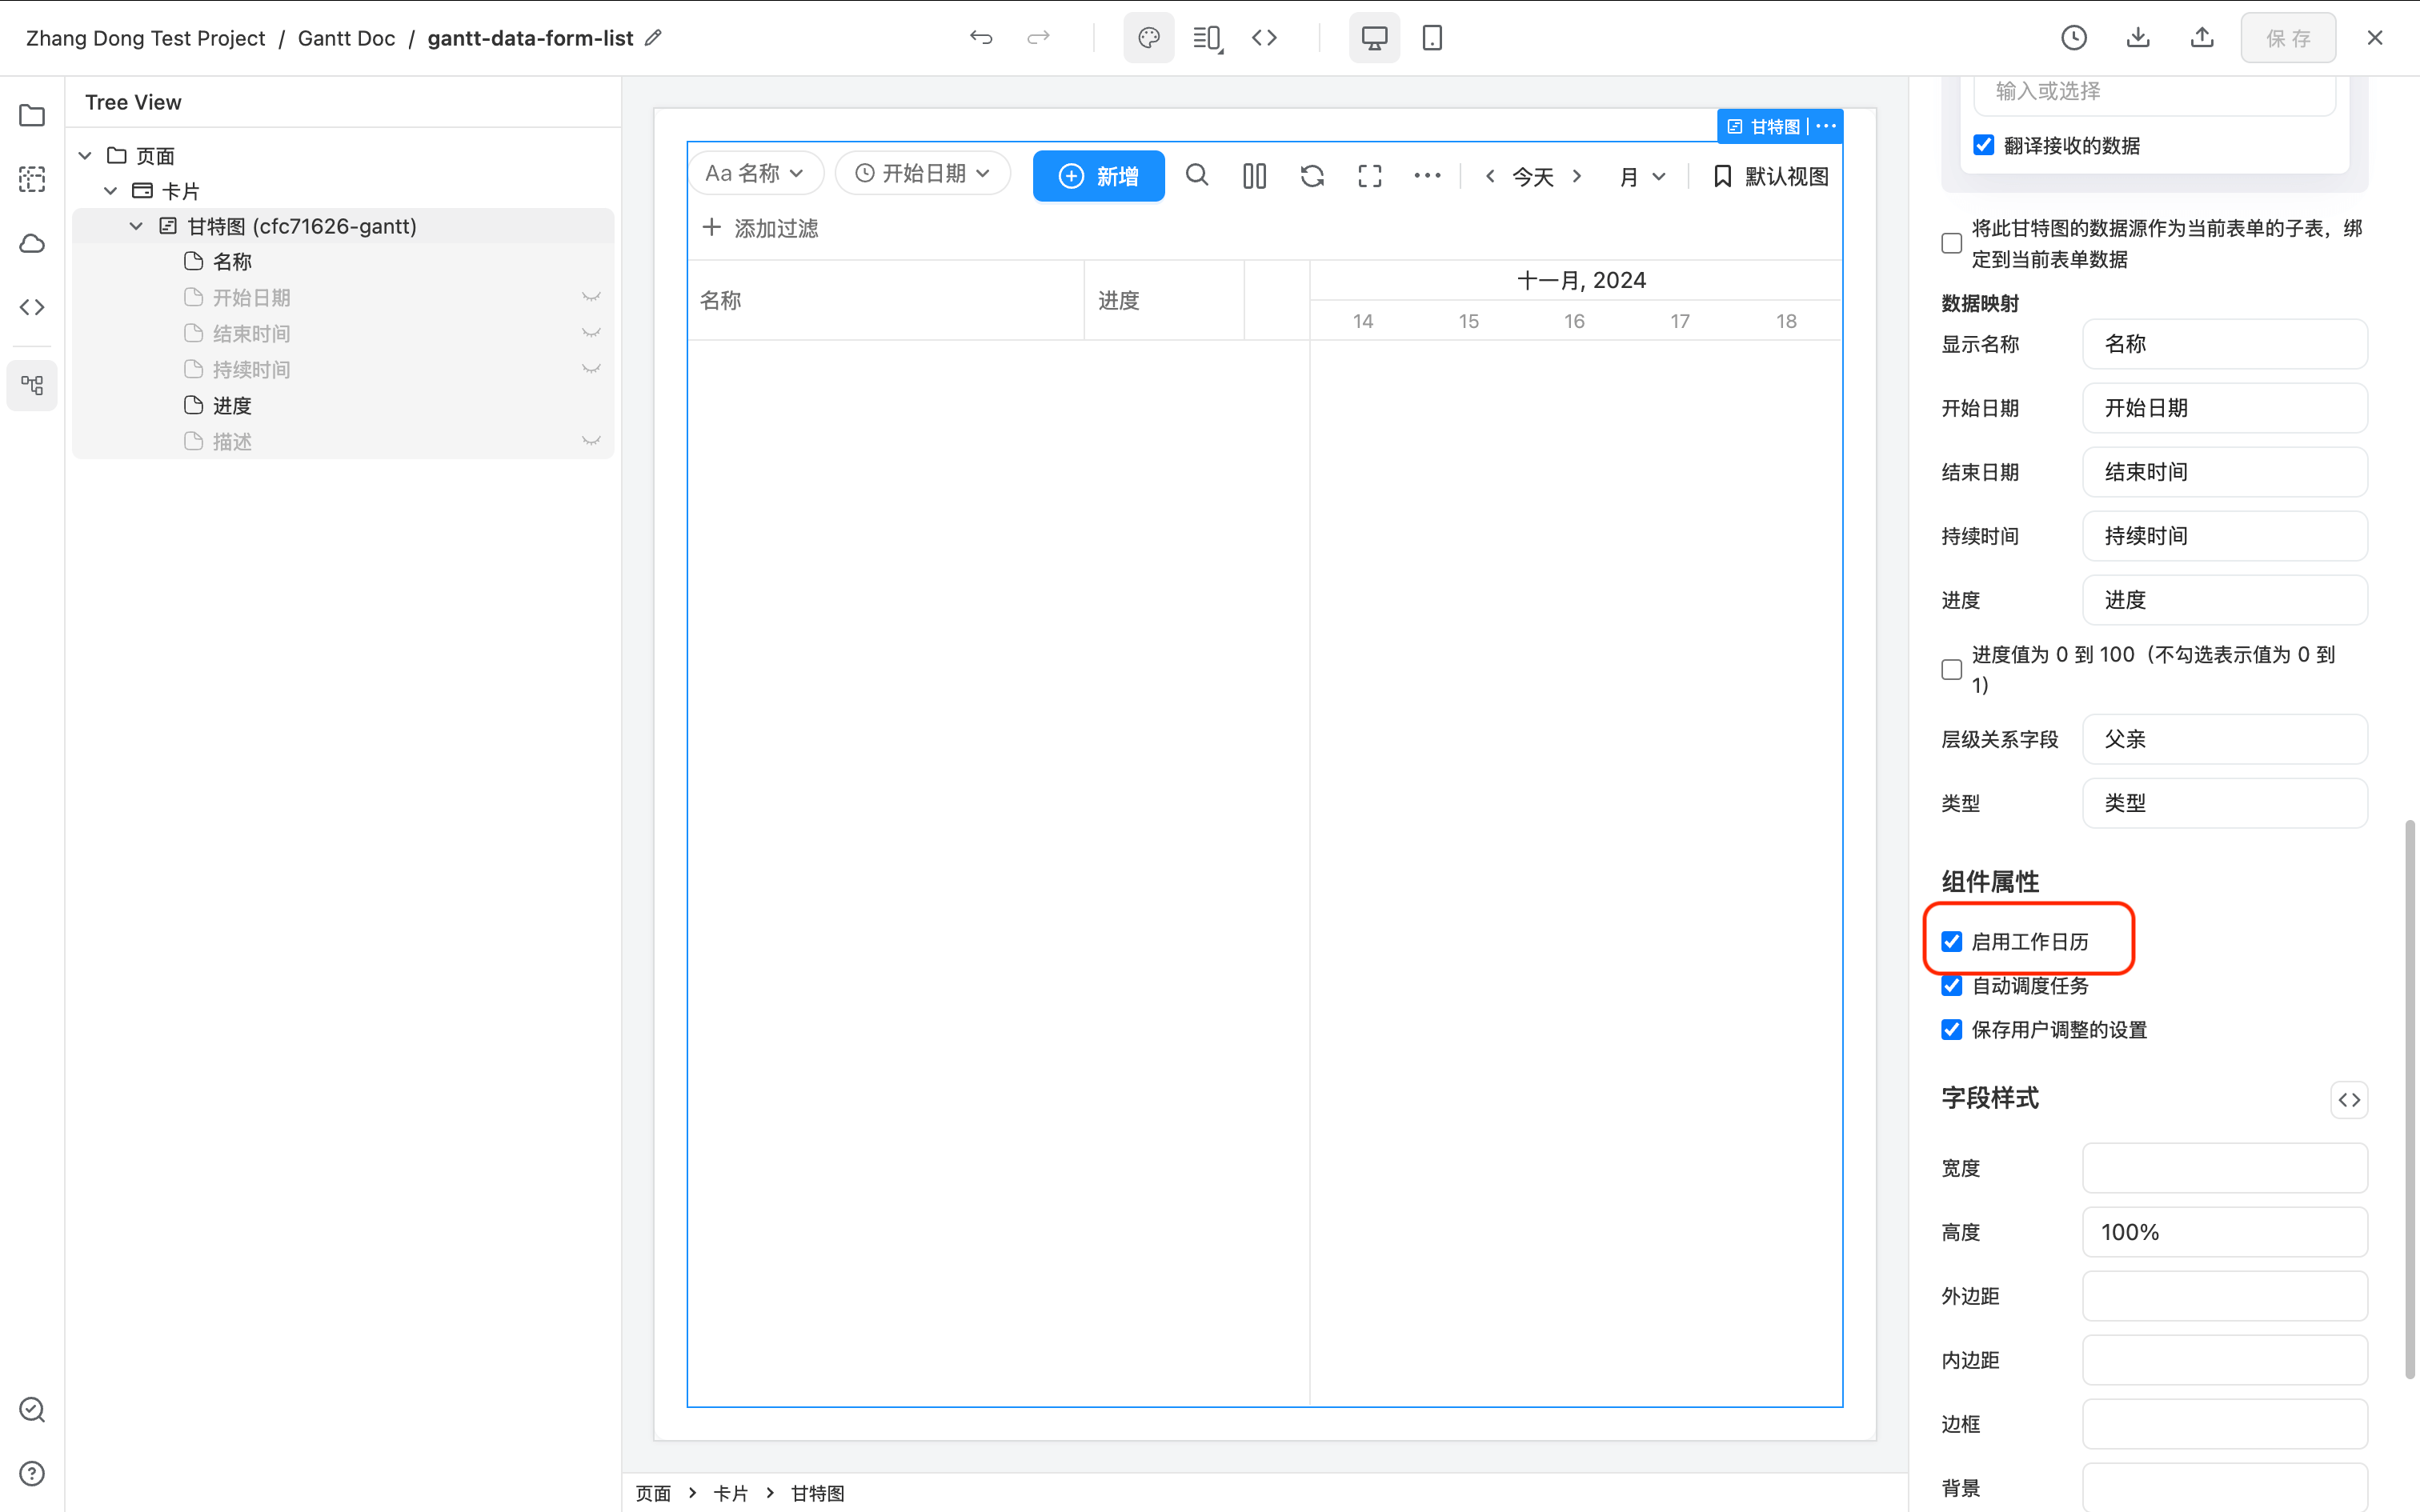
If you want to customize the default Monday-to-Friday working calendar or add holidays, you can create a custom working calendar data source:
The data source needs to return data in the following format for the Gantt Chart:
const calendar = [{
  id: '0001',
  name: 'Normal Working Calendar',
  // Default working hours
  worktime: {
    days: [0, 1, 1, 1, 1, 1, 0],
    hours: ['9:00-18:00'],
  },
  // Holidays
  holidays: [
    // New Year's Day
    { date: '2024-01-01', hours: false },
  ],
}]
Calendar data must contain the following fields:
id, theidof the calendar, used to distinguish different calendars;name, the name displayed by the calendar;worktime, rules that define working hours, wheredays, an array of 7 days from Sunday to Monday,0represents the rest day and1represents the working day. For example, as shown in the above example, Monday to Friday are working days and Saturday and Sunday are off days;hours, working hours every day. For example, as shown in the above example, from 9:00 to 18:00 a day is working hours;
holidays, rules that define holidays, wheredate, the date of the holiday, accurate to year, month and day;hours, indicating whether it is a rest day or a working day.falsemeans non-working day,truemeans working day (for example, adjustment of leave)
Calendar data can be an array containing multiple calendars. Users can freely switch to select different calendars on the page, where "Normal Work Calendar" defines a complete holiday. "Special Work Calendar" Use a work calendar that works 6 days a week.
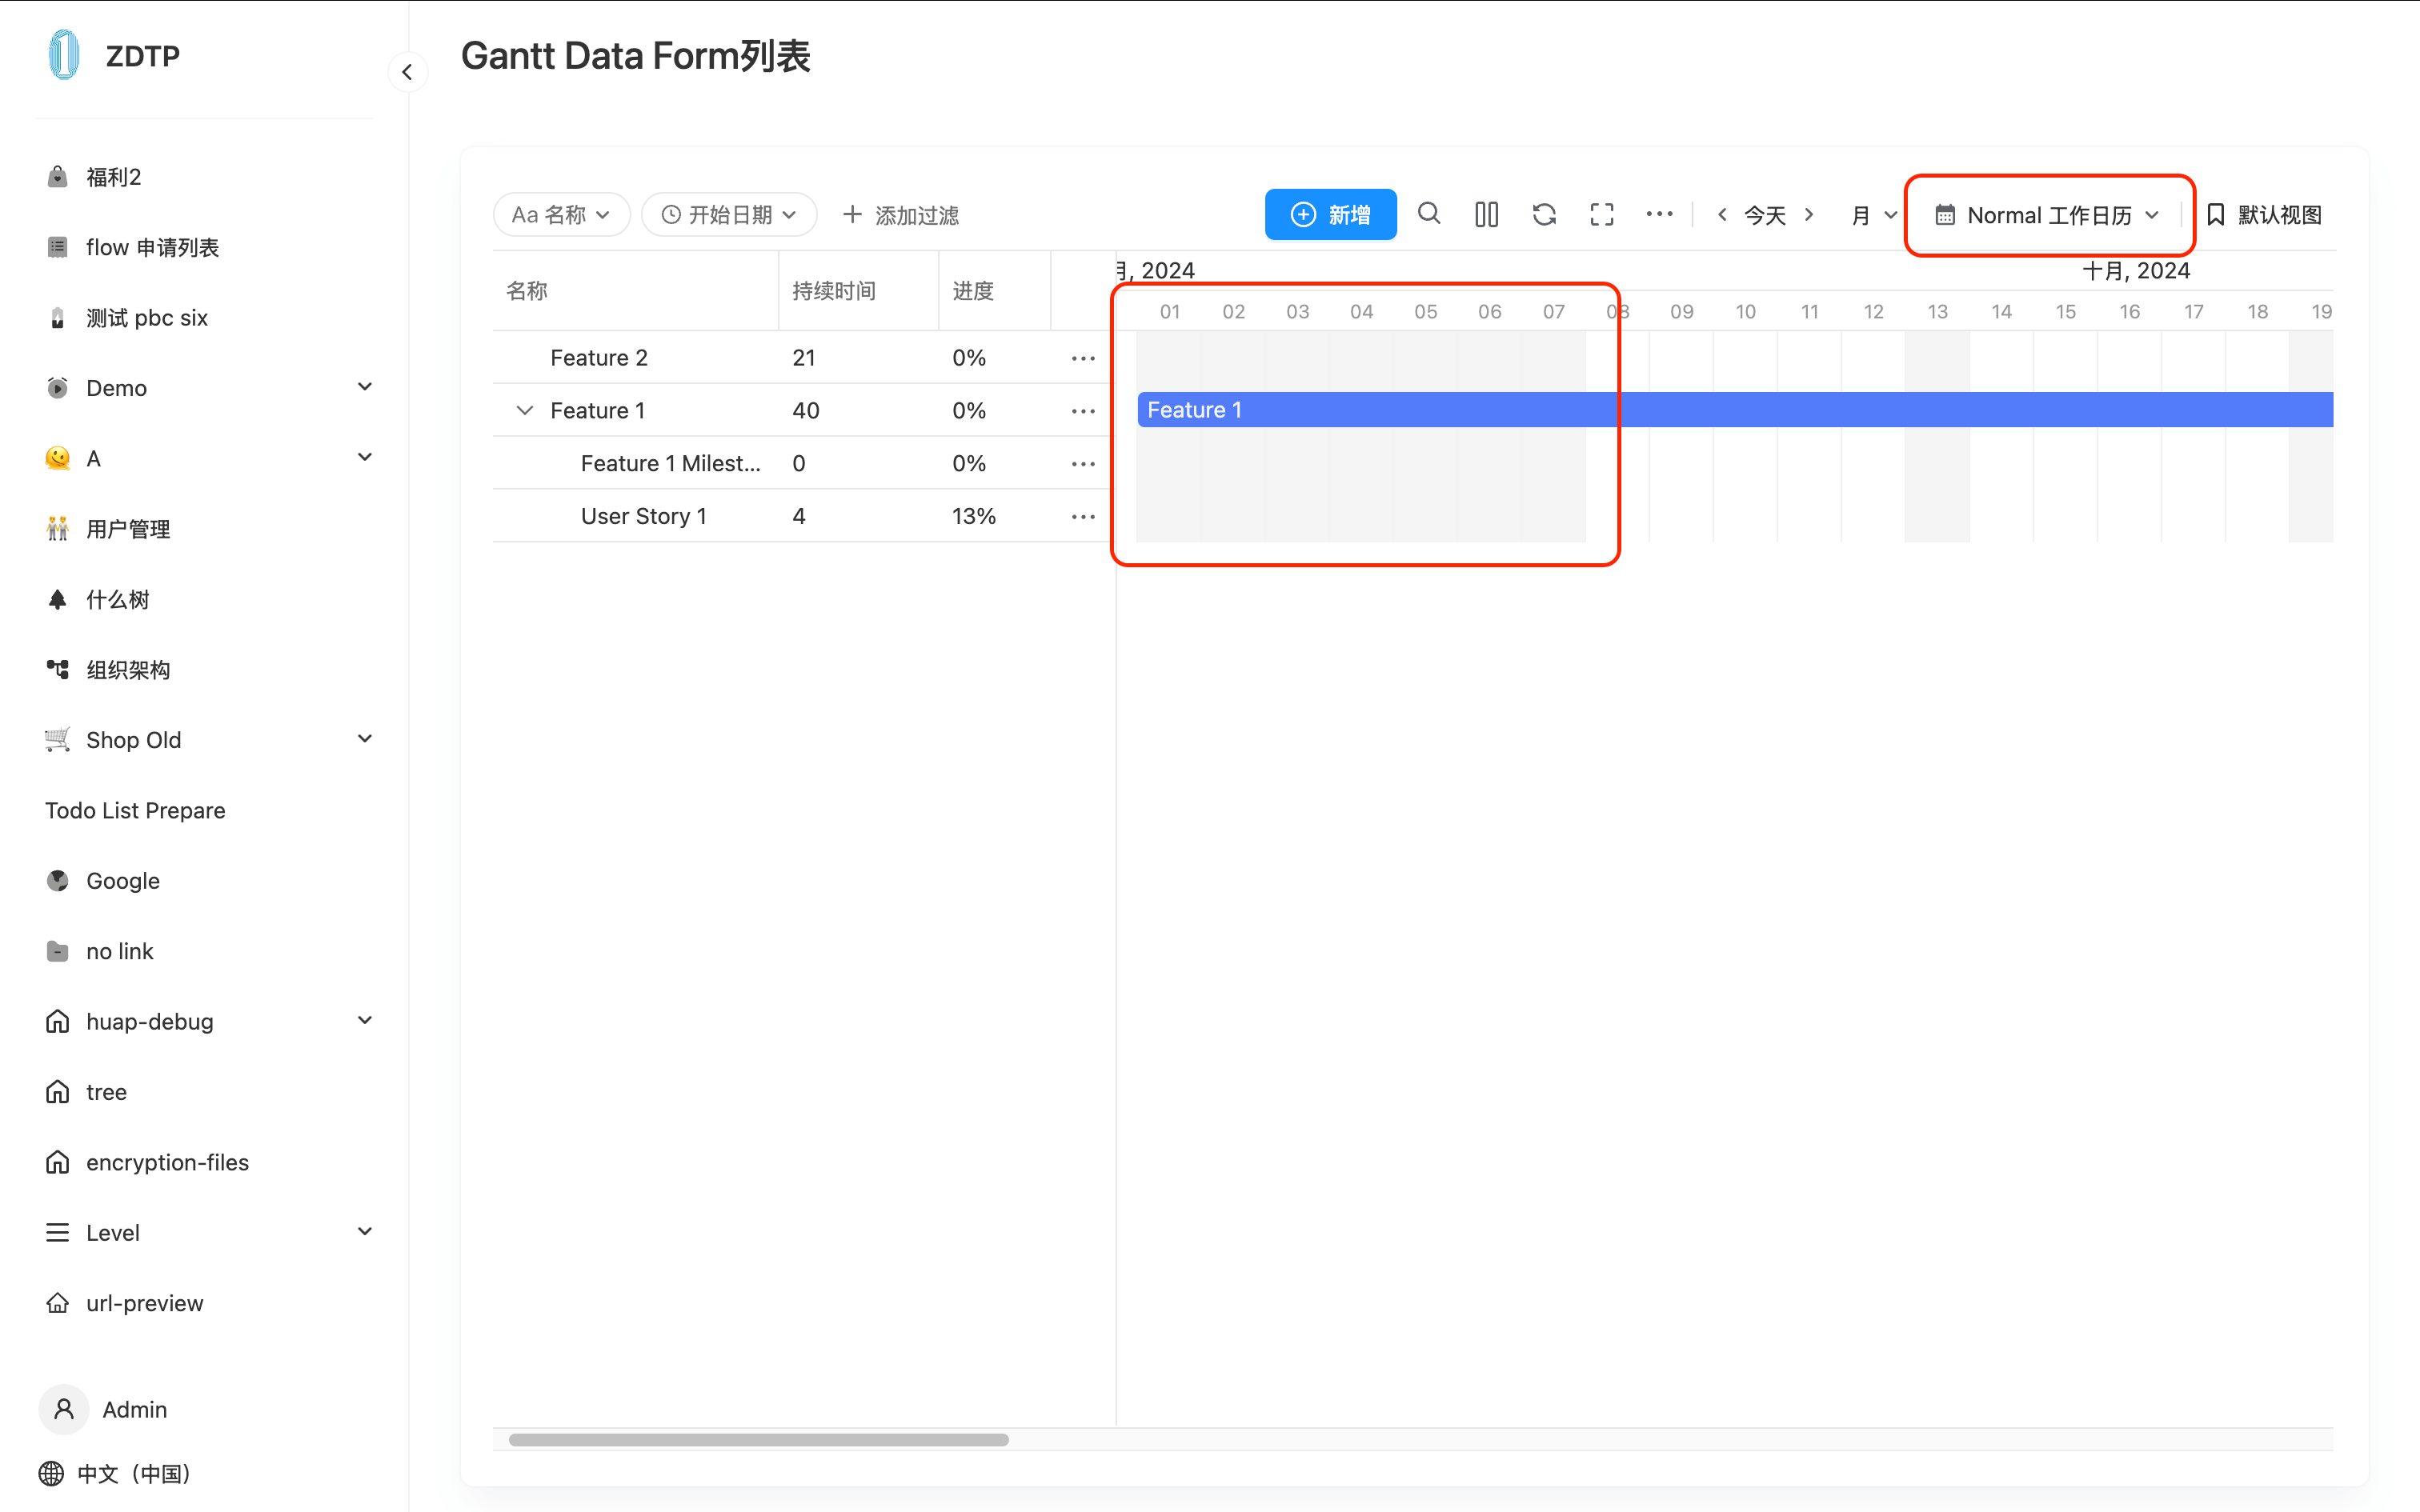
As shown in the following figure, I configured two work calendar examples for 2024:
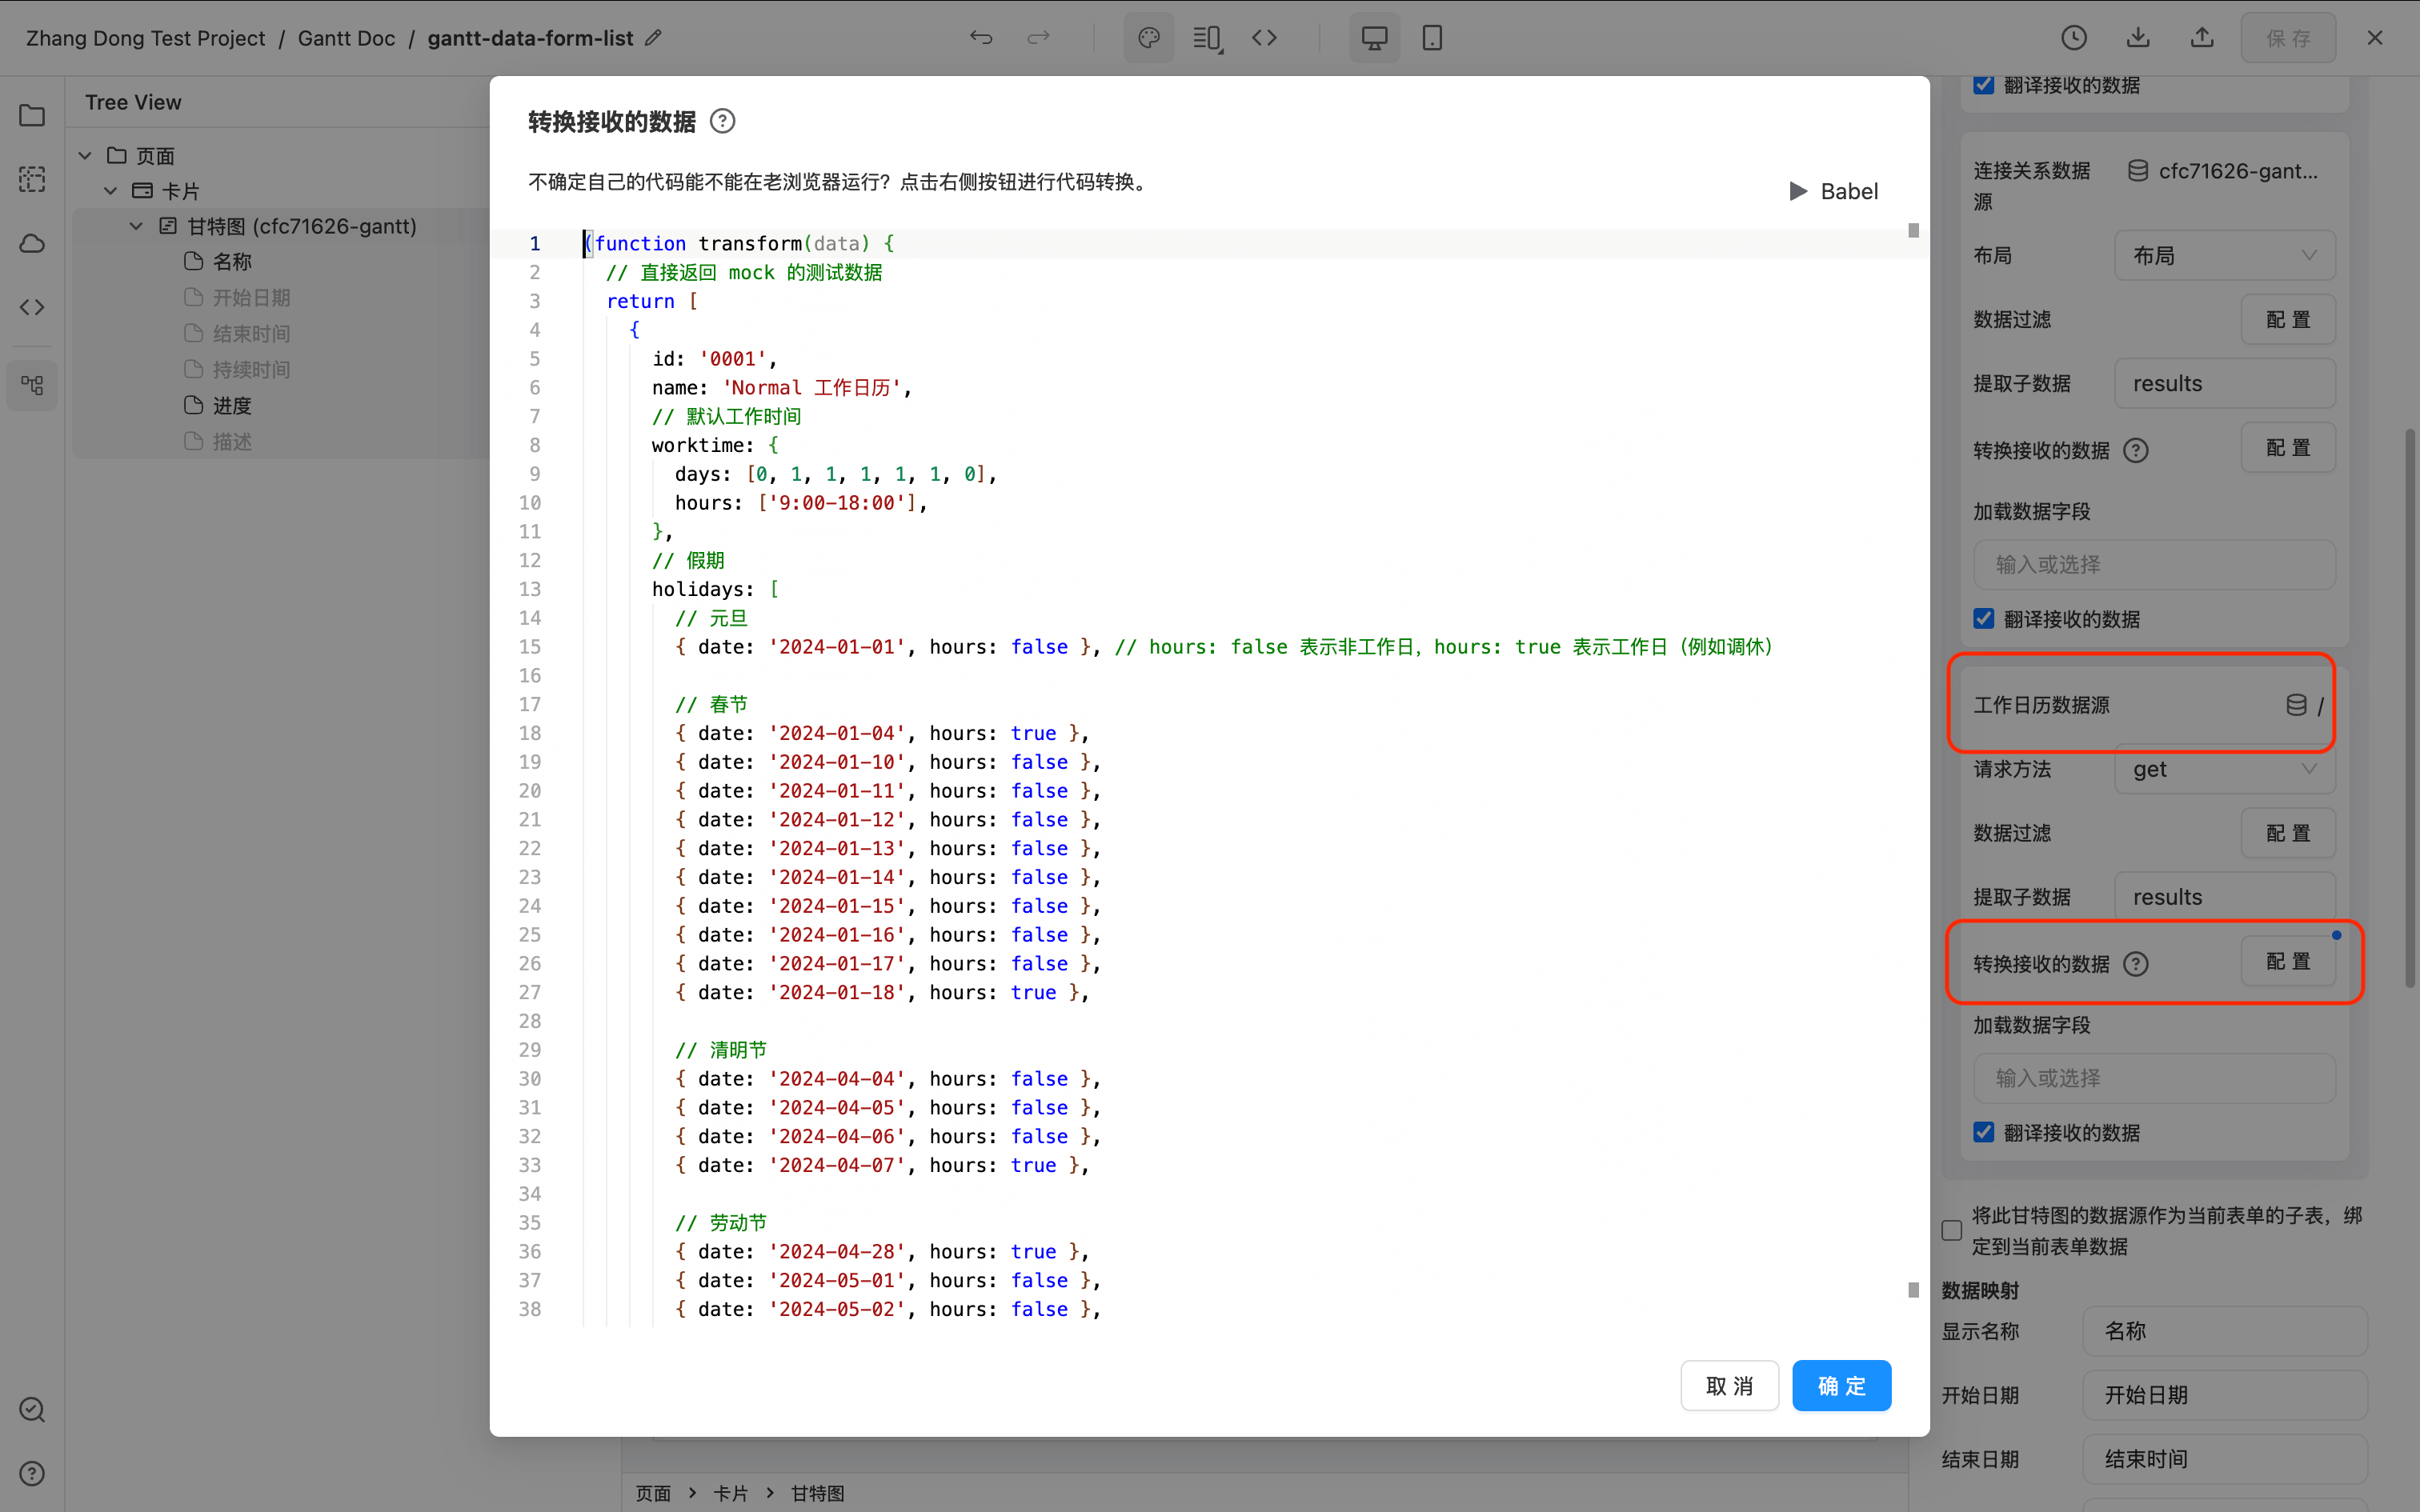
The real data source is not set. The / is written in the data source to ensure that the request does not make any errors, and then the test data returned directly in "Convert accepted data".
You can see that the Gantt image has been displayed according to custom holiday rules, and the Toolbar can switch to different work calendars in the upper right corner.
The "Transform Received Data" sample data for that work calendar is as follows:
(function transform(data) {
  // directly return the test data of the mock
  Return [
    {
      id: '0001',
      name: 'Normal Work Calendar',
      // Default working time
      worktime: {
        days: [0, 1, 1, 1, 1, 1, 0],
        hours: ['9:00-18:00'],
      },
      // Holidays
      holidays: [
        // New Year's Day
        { date: '2024-01-01', hours: false }, // hours: false means non-working days, hours: true means working days (such as rest)

        // Spring Festival
        { date: '2024-01-04', hours: true },
        { date: '2024-01-10', hours: false },
        { date: '2024-01-11', hours: false },
        { date: '2024-01-12', hours: false },
        { date: '2024-01-13', hours: false },
        { date: '2024-01-14', hours: false },
        { date: '2024-01-15', hours: false },
        { date: '2024-01-16', hours: false },
        { date: '2024-01-17', hours: false },
        { date: '2024-01-18', hours: true },

        // Qingming Festival
        { date: '2024-04-04', hours: false },
        { date: '2024-04-05', hours: false },
        { date: '2024-04-06', hours: false },
        { date: '2024-04-07', hours: true },

        // Labor Day
        { date: '2024-04-28', hours: true },
        { date: '2024-05-01', hours: false },
        { date: '2024-05-02', hours: false },
        { date: '2024-05-03', hours: false },
        { date: '2024-05-04', hours: false },
        { date: '2024-05-05', hours: false },
        { date: '2024-05-11', hours: true },

        // Dragon Boat Festival
        { date: '2024-06-10', hours: false },

        // Mid-Autumn Festival
        { date: '2024-09-15', hours: false },
        { date: '2024-09-16', hours: false },
        { date: '2024-09-17', hours: false },

        // National Day
        { date: '2024-09-29', hours: true },
        { date: '2024-10-01', hours: false },
        { date: '2024-10-02', hours: false },
        { date: '2024-10-03', hours: false },
        { date: '2024-10-04', hours: false },
        { date: '2024-10-05', hours: false },
        { date: '2024-10-06', hours: false },
        { date: '2024-10-07', hours: false },
        { date: '2024-10-12', hours: true },
      ],
    },
    {
      id: '0002',
      name: 'Special Work Calendar',
      worktime: {
        days: [1, 1, 1, 1, 1, 1, 0],
        hours: ['9:00-18:00'],
      },
    },
  ];
})(this);
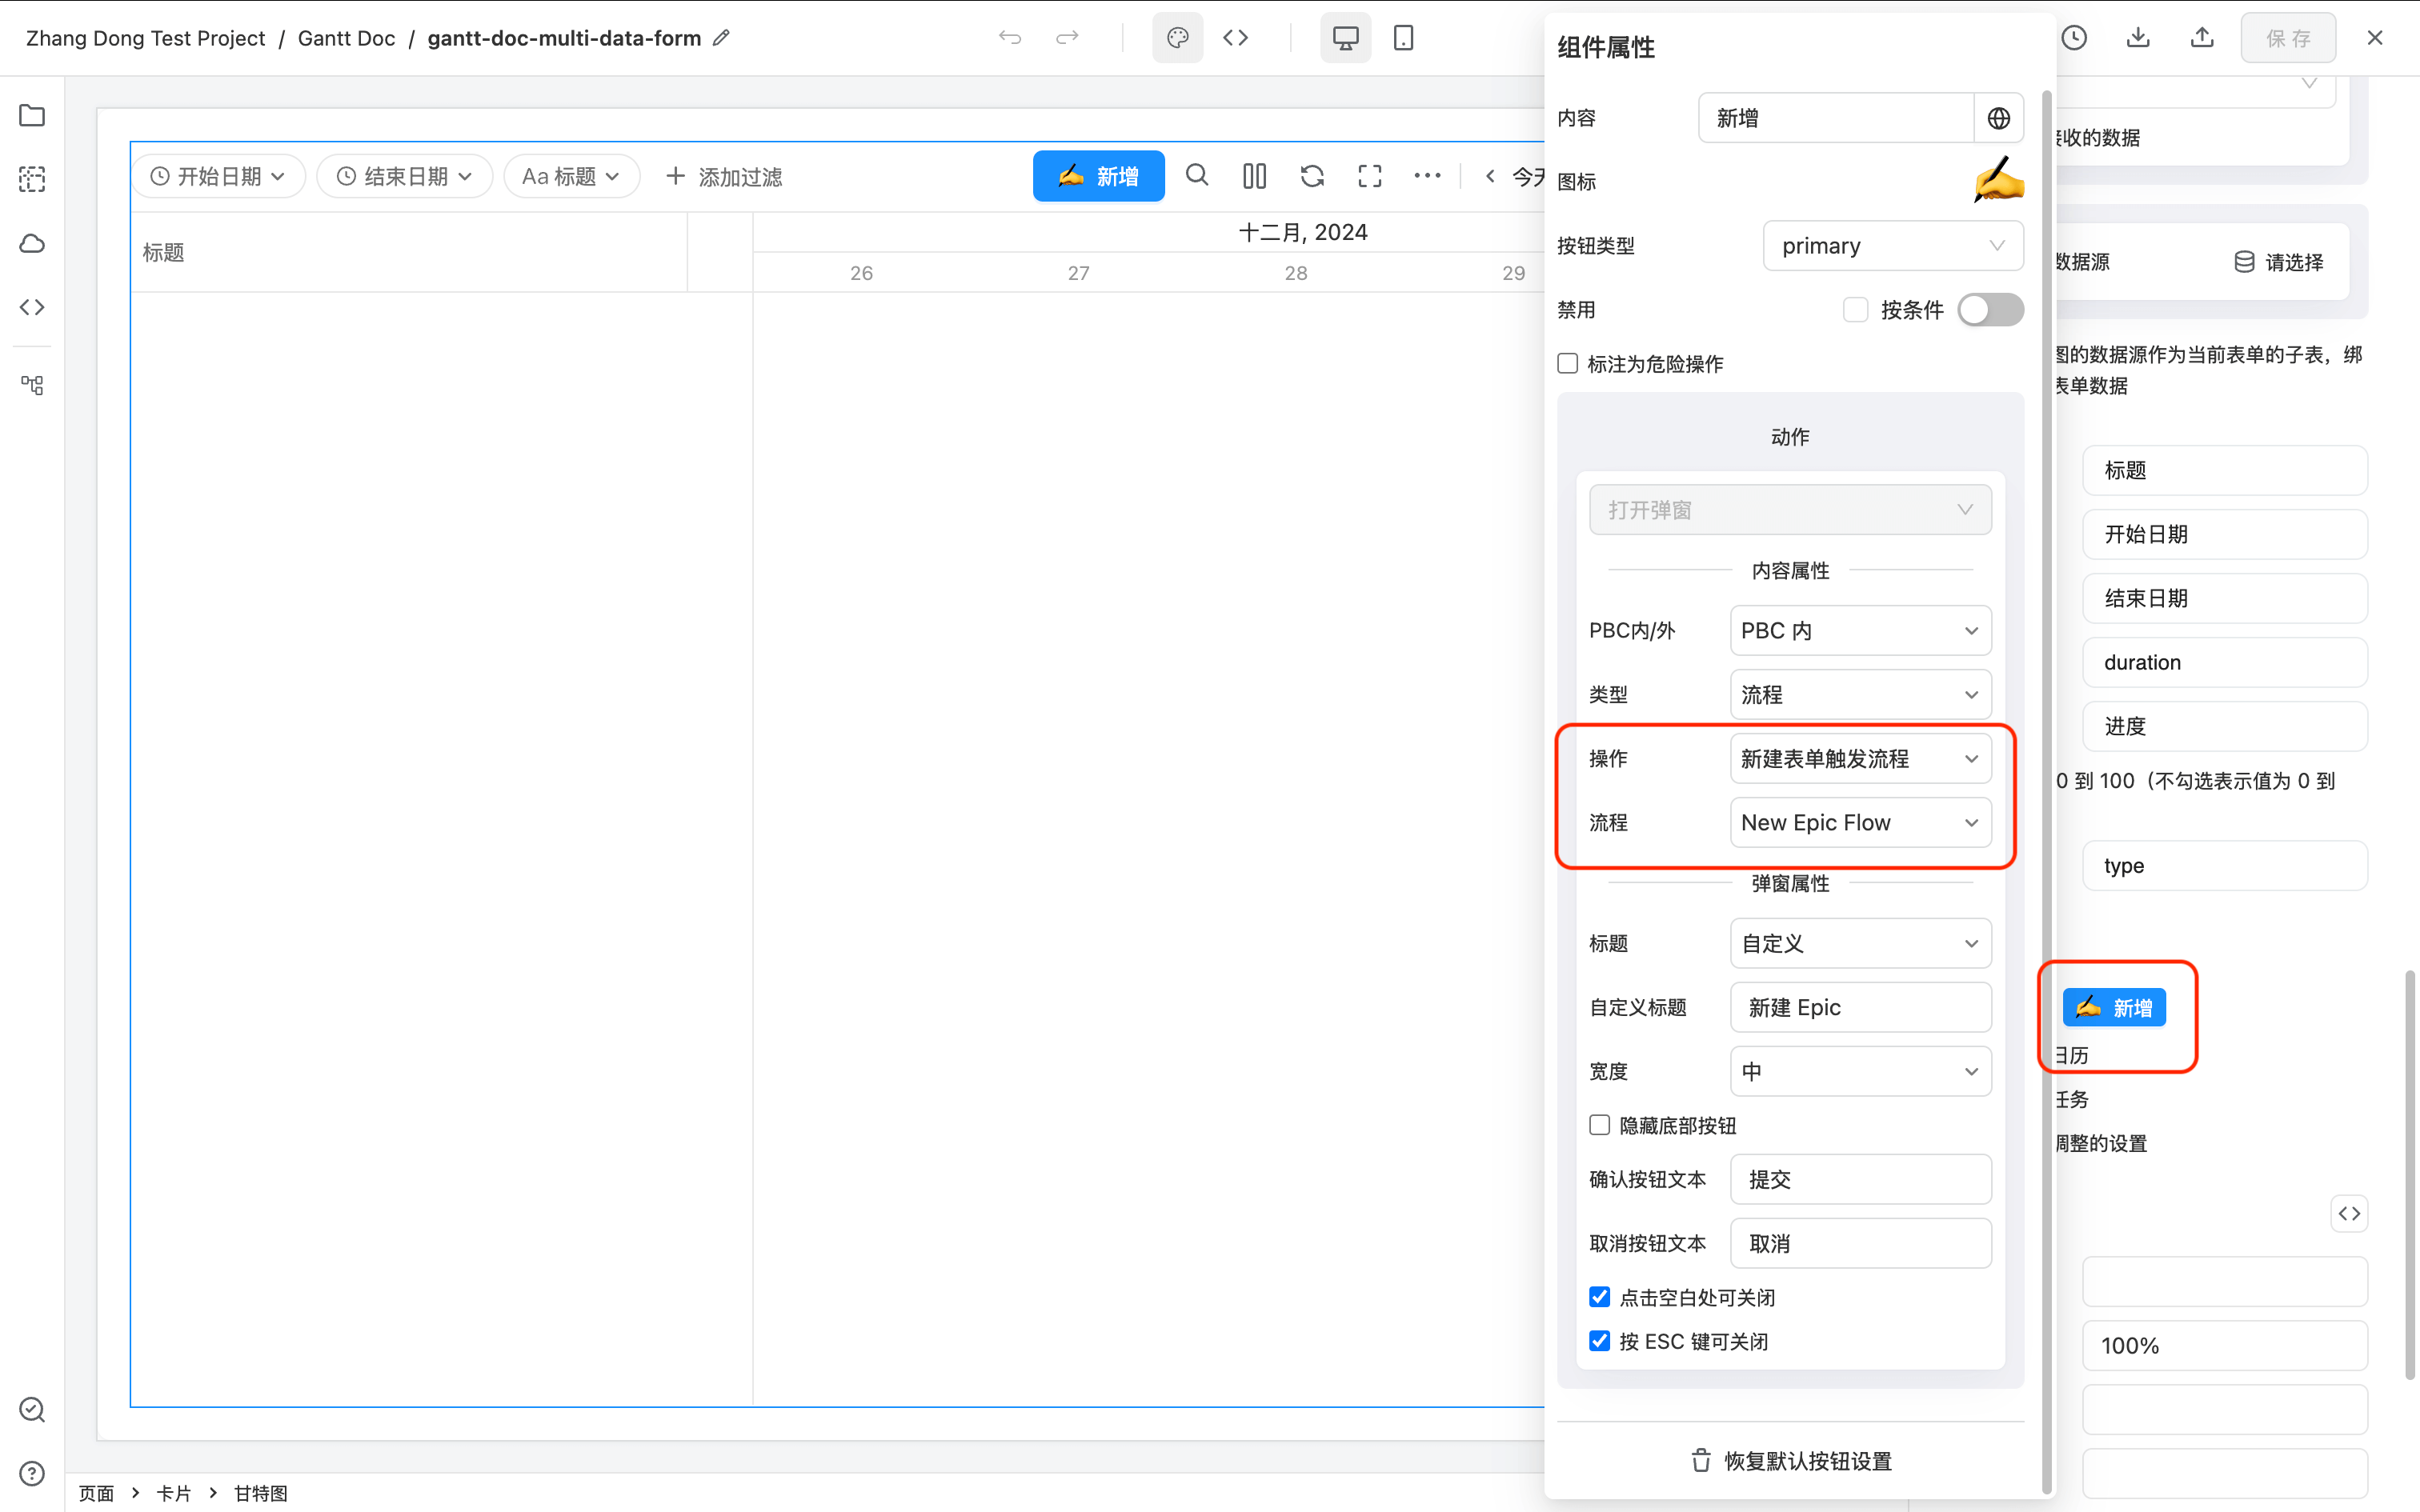
Create a new task process (customize Add, Edit, Delete buttons)
By default, the Gantt diagram will come with a Add button in the Toolbar, and three buttons in each task operation column **Add subtasks Edit Delete, And the interface operation data of the form data source will be automatically called. If you want to customize the behavior of these buttons, e.g.
- Follow the process when new
- Show /Hide buttons according to permission conditions
- Modify properties such as button icon and text
- Modify the title, size and other properties of Dialog
And so on, they can be set separately.
-
Due to Gantt graph limitations, these 4 buttons cannot add ** actions after success**, cannot modify button actions, and some other default properties.
-
Toolbar's new task button and the new subtask button for each data need to be set separately.
Supports decimal point Duration (TODO)
Drag and drop for custom sorting (TODO)
Do not save data in real time, and after adjusting all data, click Button to save (TODO)
Add Gantt view on existing tables
Add Gantt View
Suppose there is now a table with two fields in the table, starting date and end date and data already exists, now I want to add a Gantt view to the table.
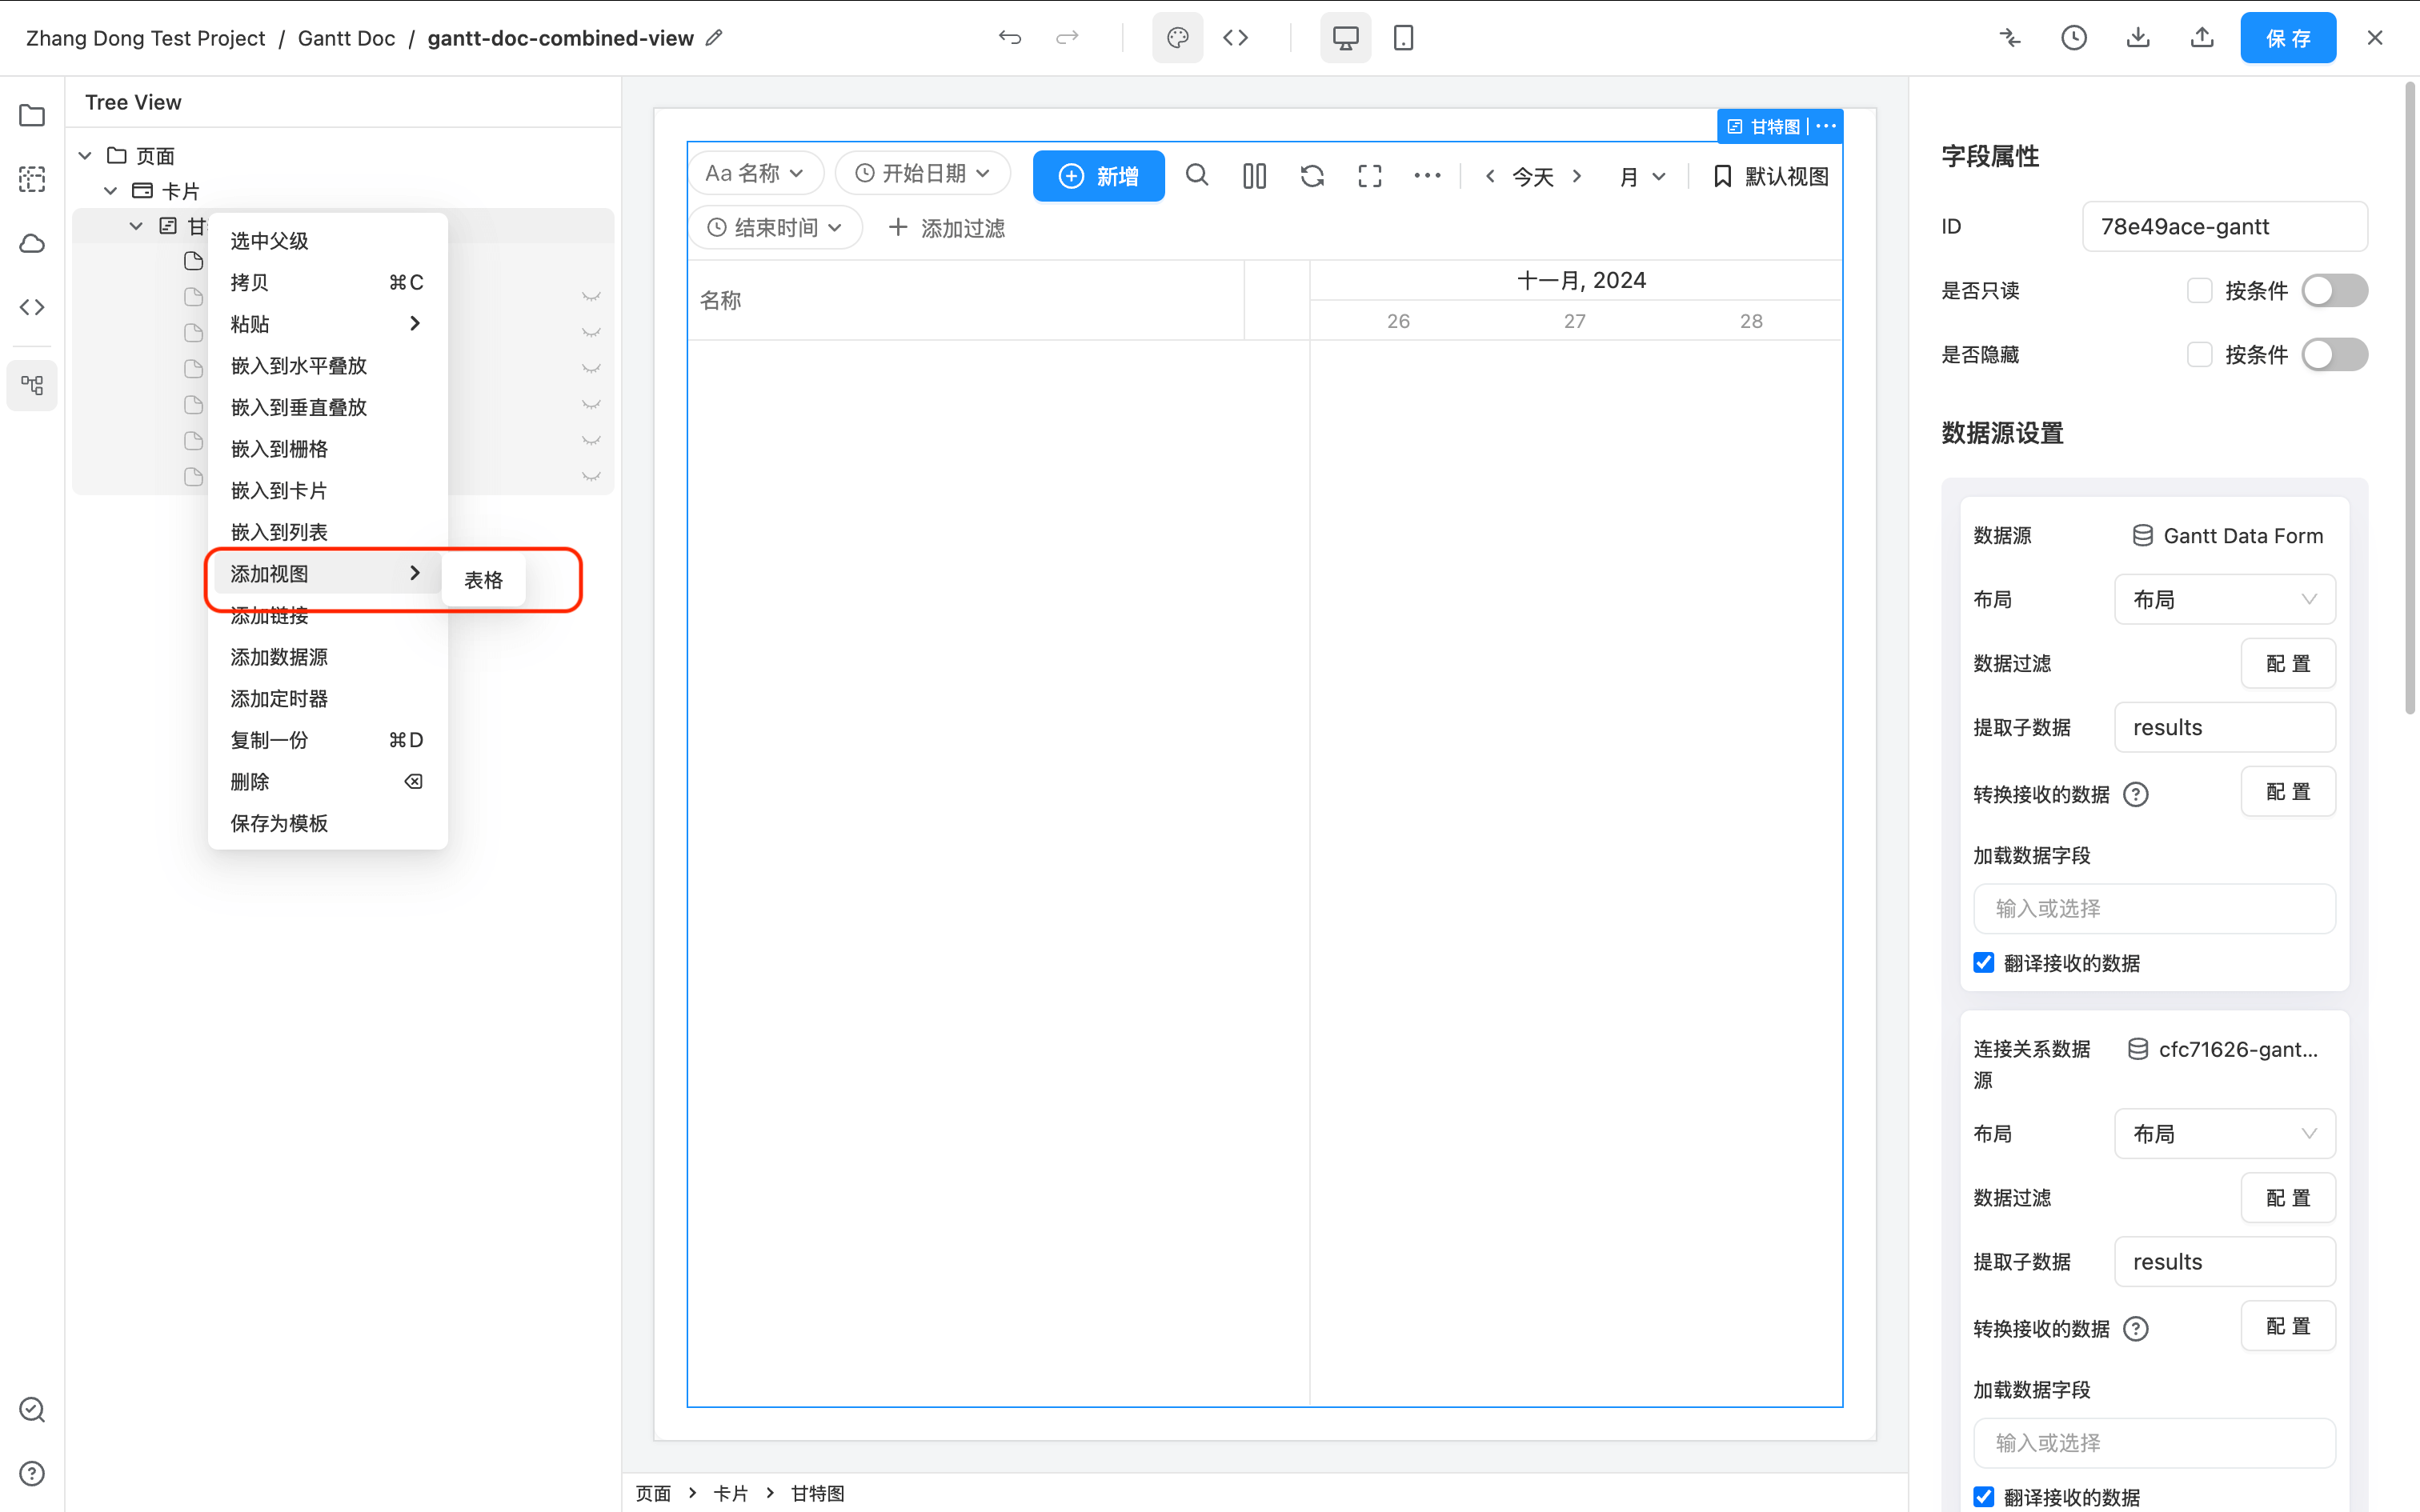
You can right-click -> Add View -> Gantt Chart on the table to add a Gantt view.
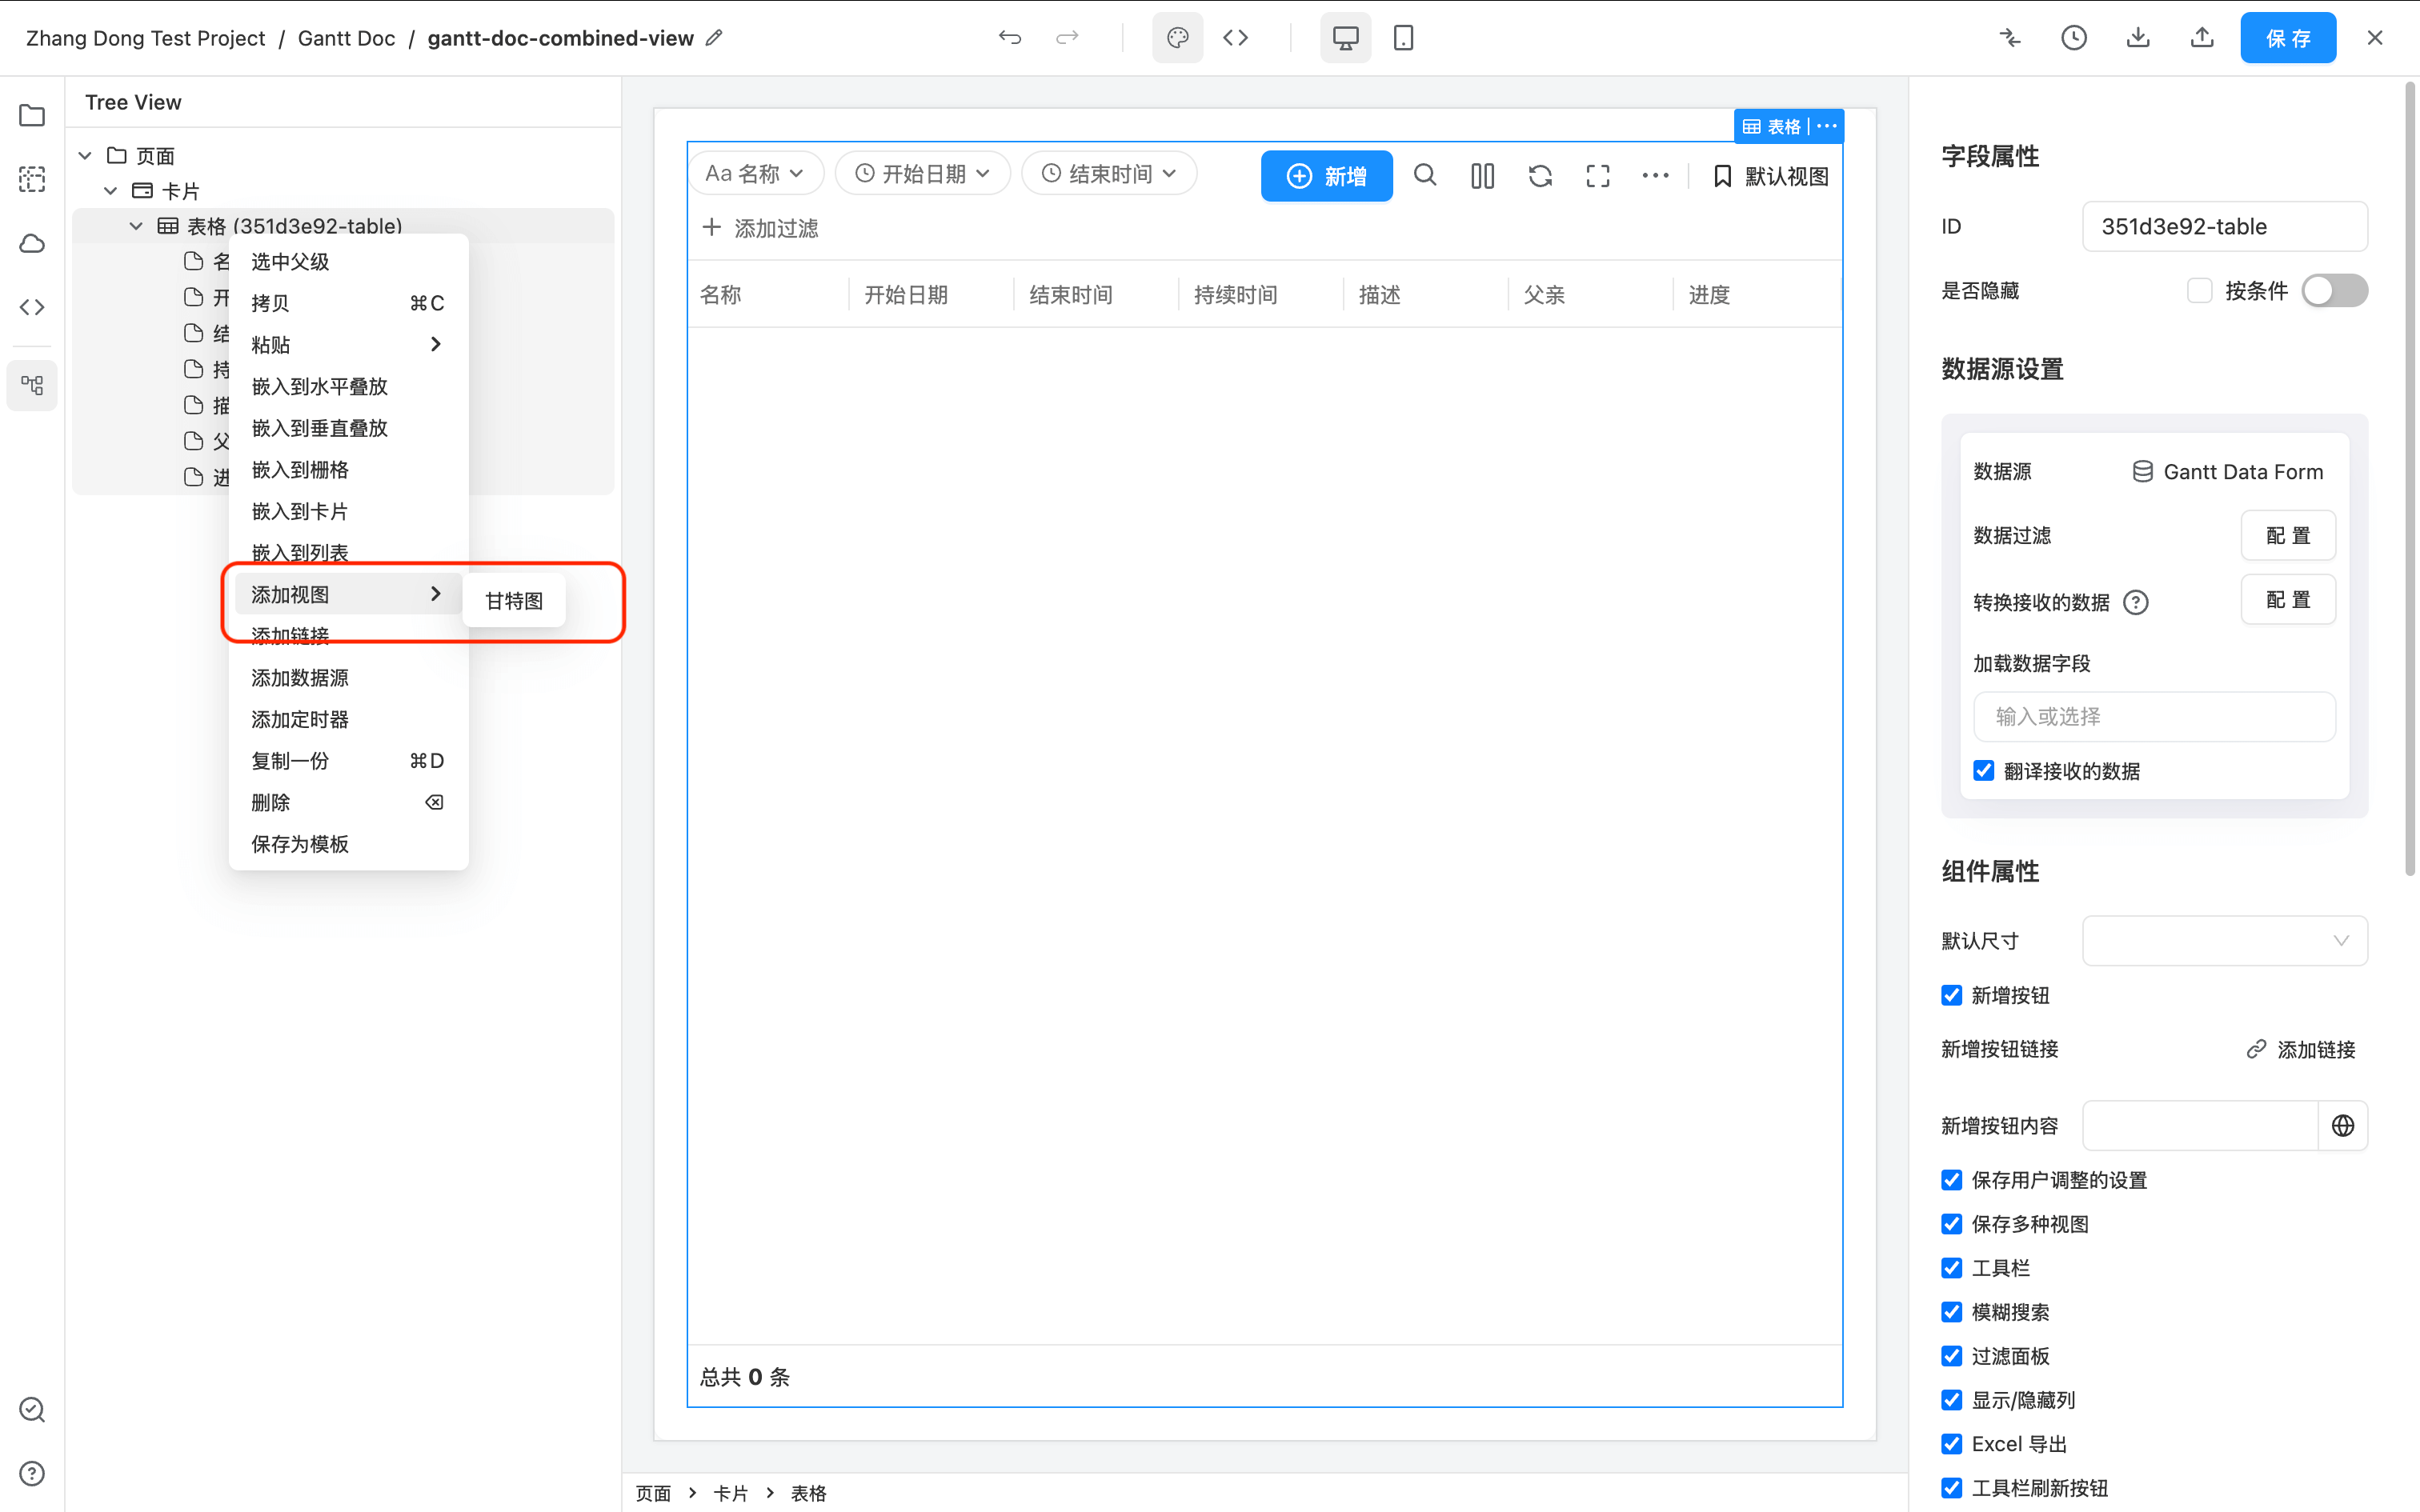
At the same time, set the Gantt diagram function according to the needs.
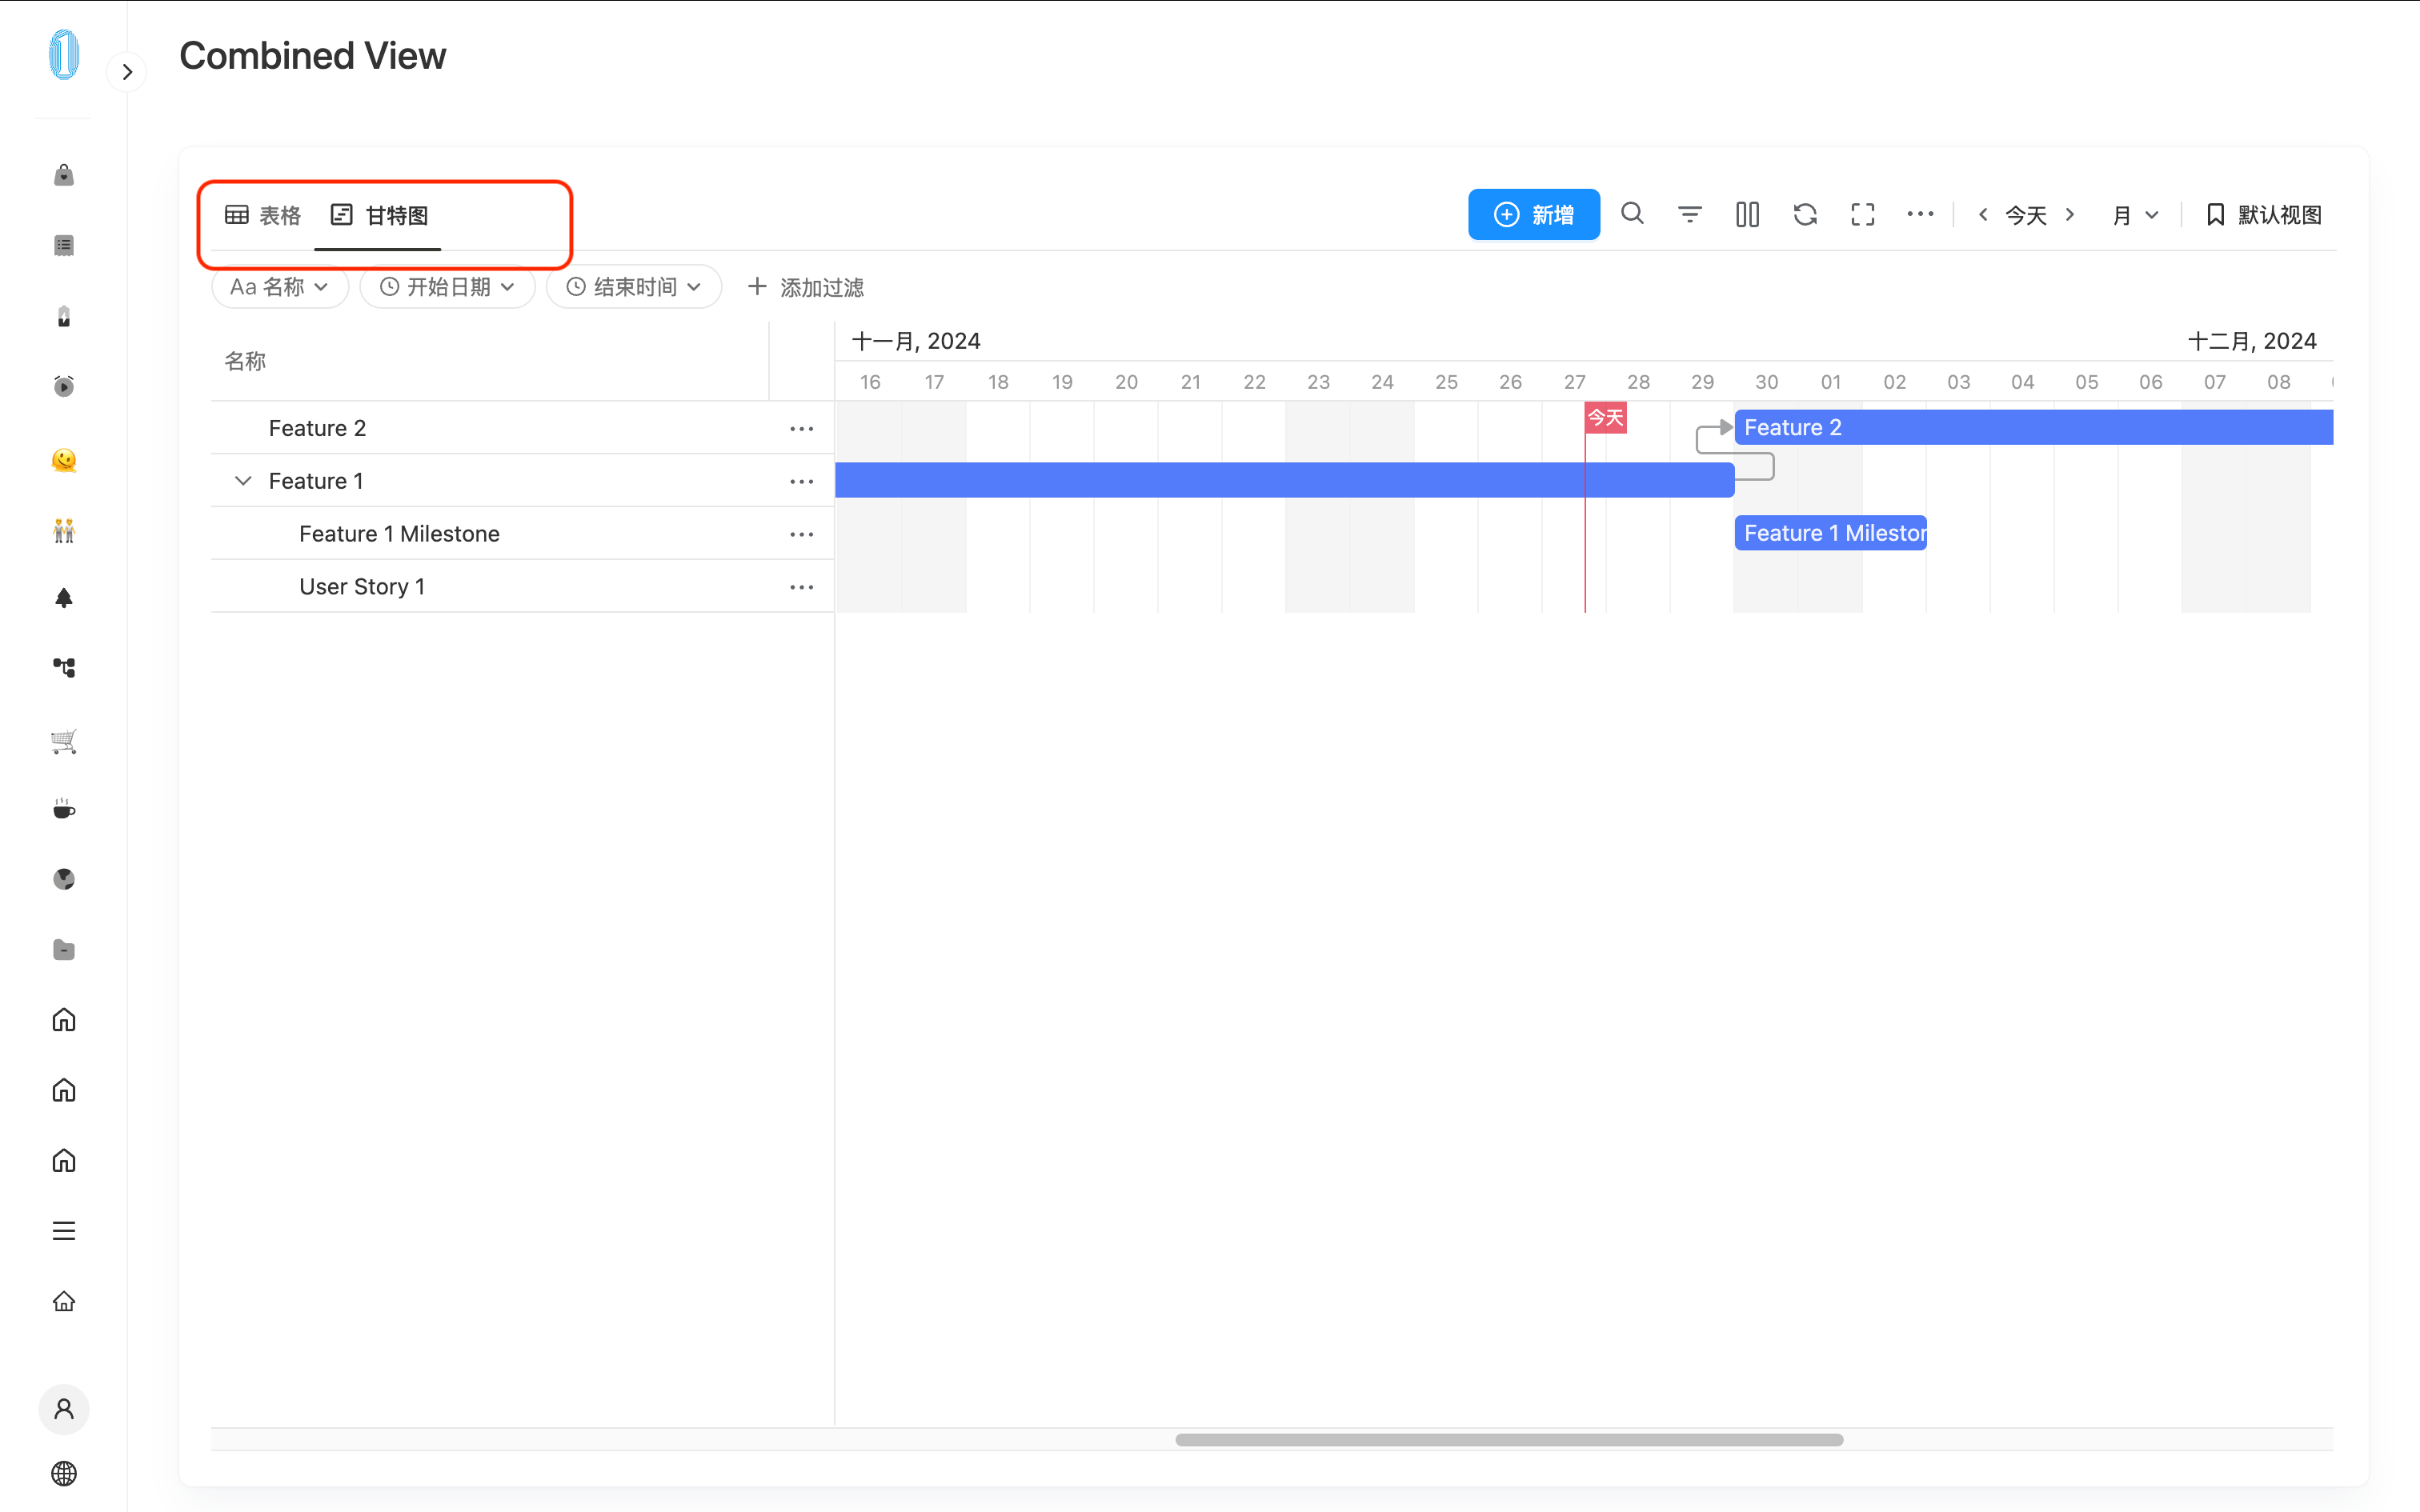
At this time, go to visit this page and you can see that there is an additional Gantt view in the upper left of the table. Click to switch to the Gantt view.
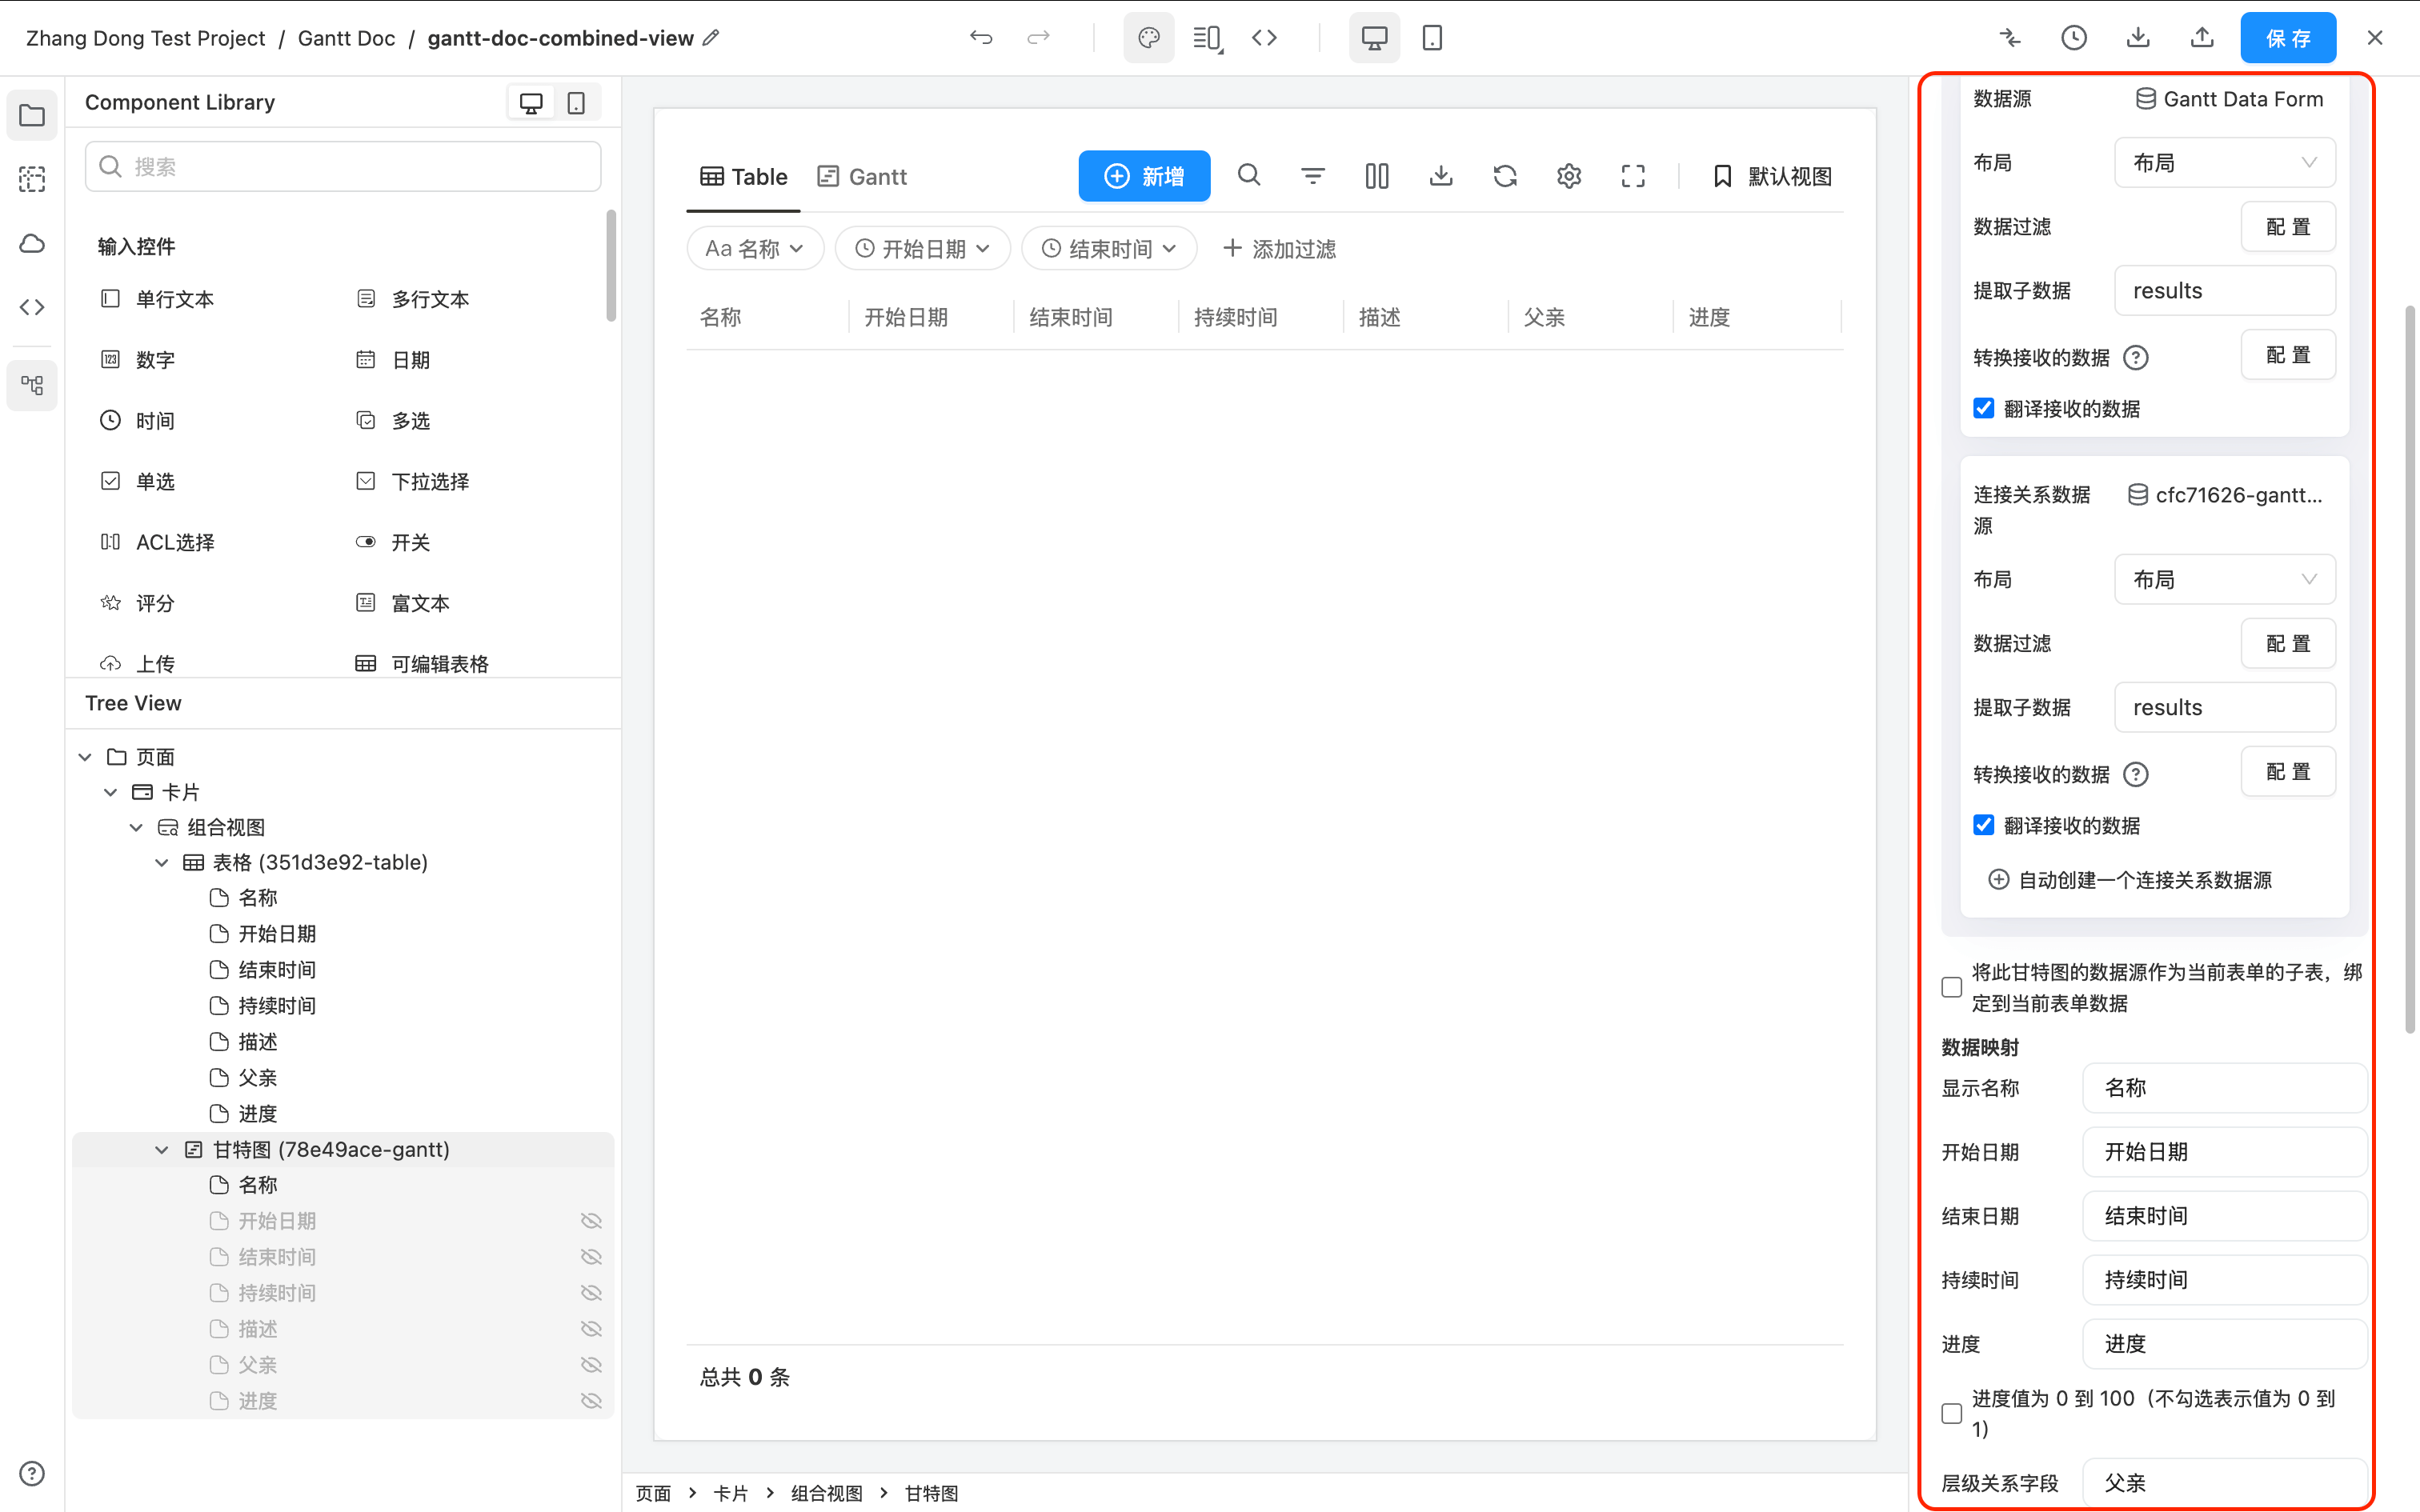
Add Table View
Similarly, if you already have a Gantt diagram, you want to add a Table view on this basis.
You can right-click -> Add View -> Table above Gantt to add a Table view.
There can only be one Gantt view and one Table view under a "Combination View".
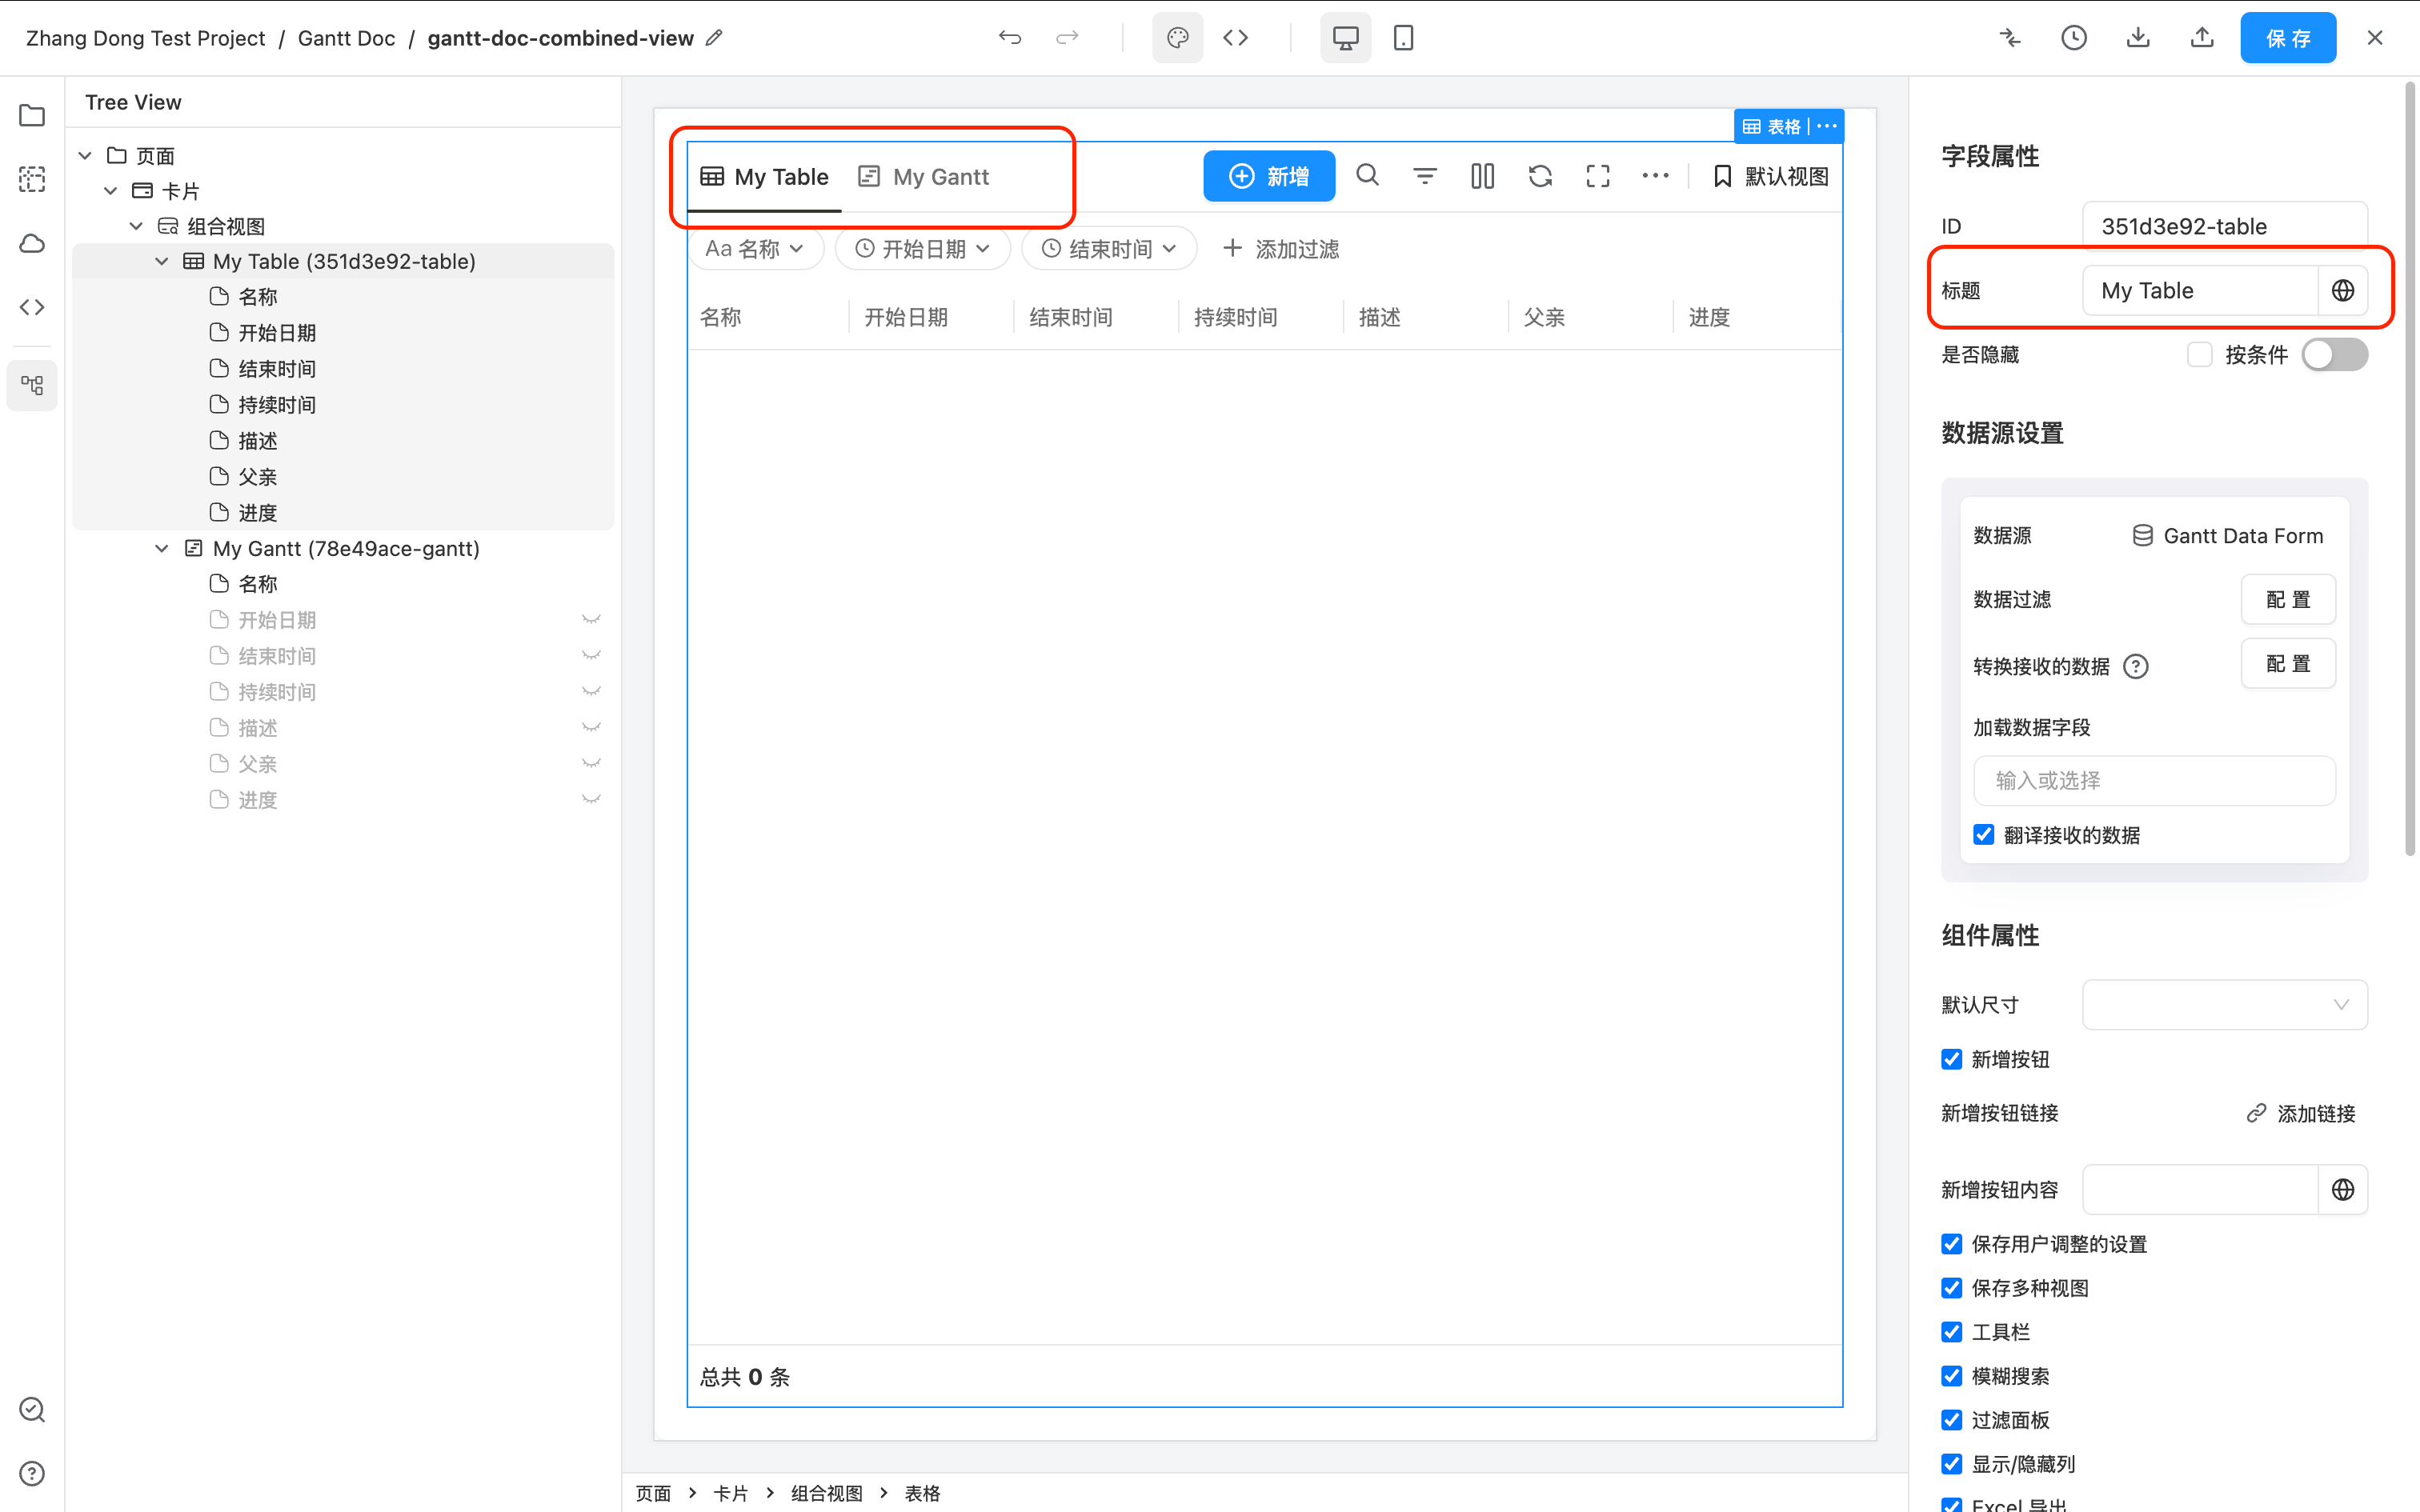
Modify the "Table" and "Gantt Chart" text displayed by default in the toggle view.
By default, under Combined View, the upper left corner of the Gantt diagram will display two texts "Table" and "Gantt Chart" to switch views. You can modify the "display name" of Gantt and Table to modify these two texts.
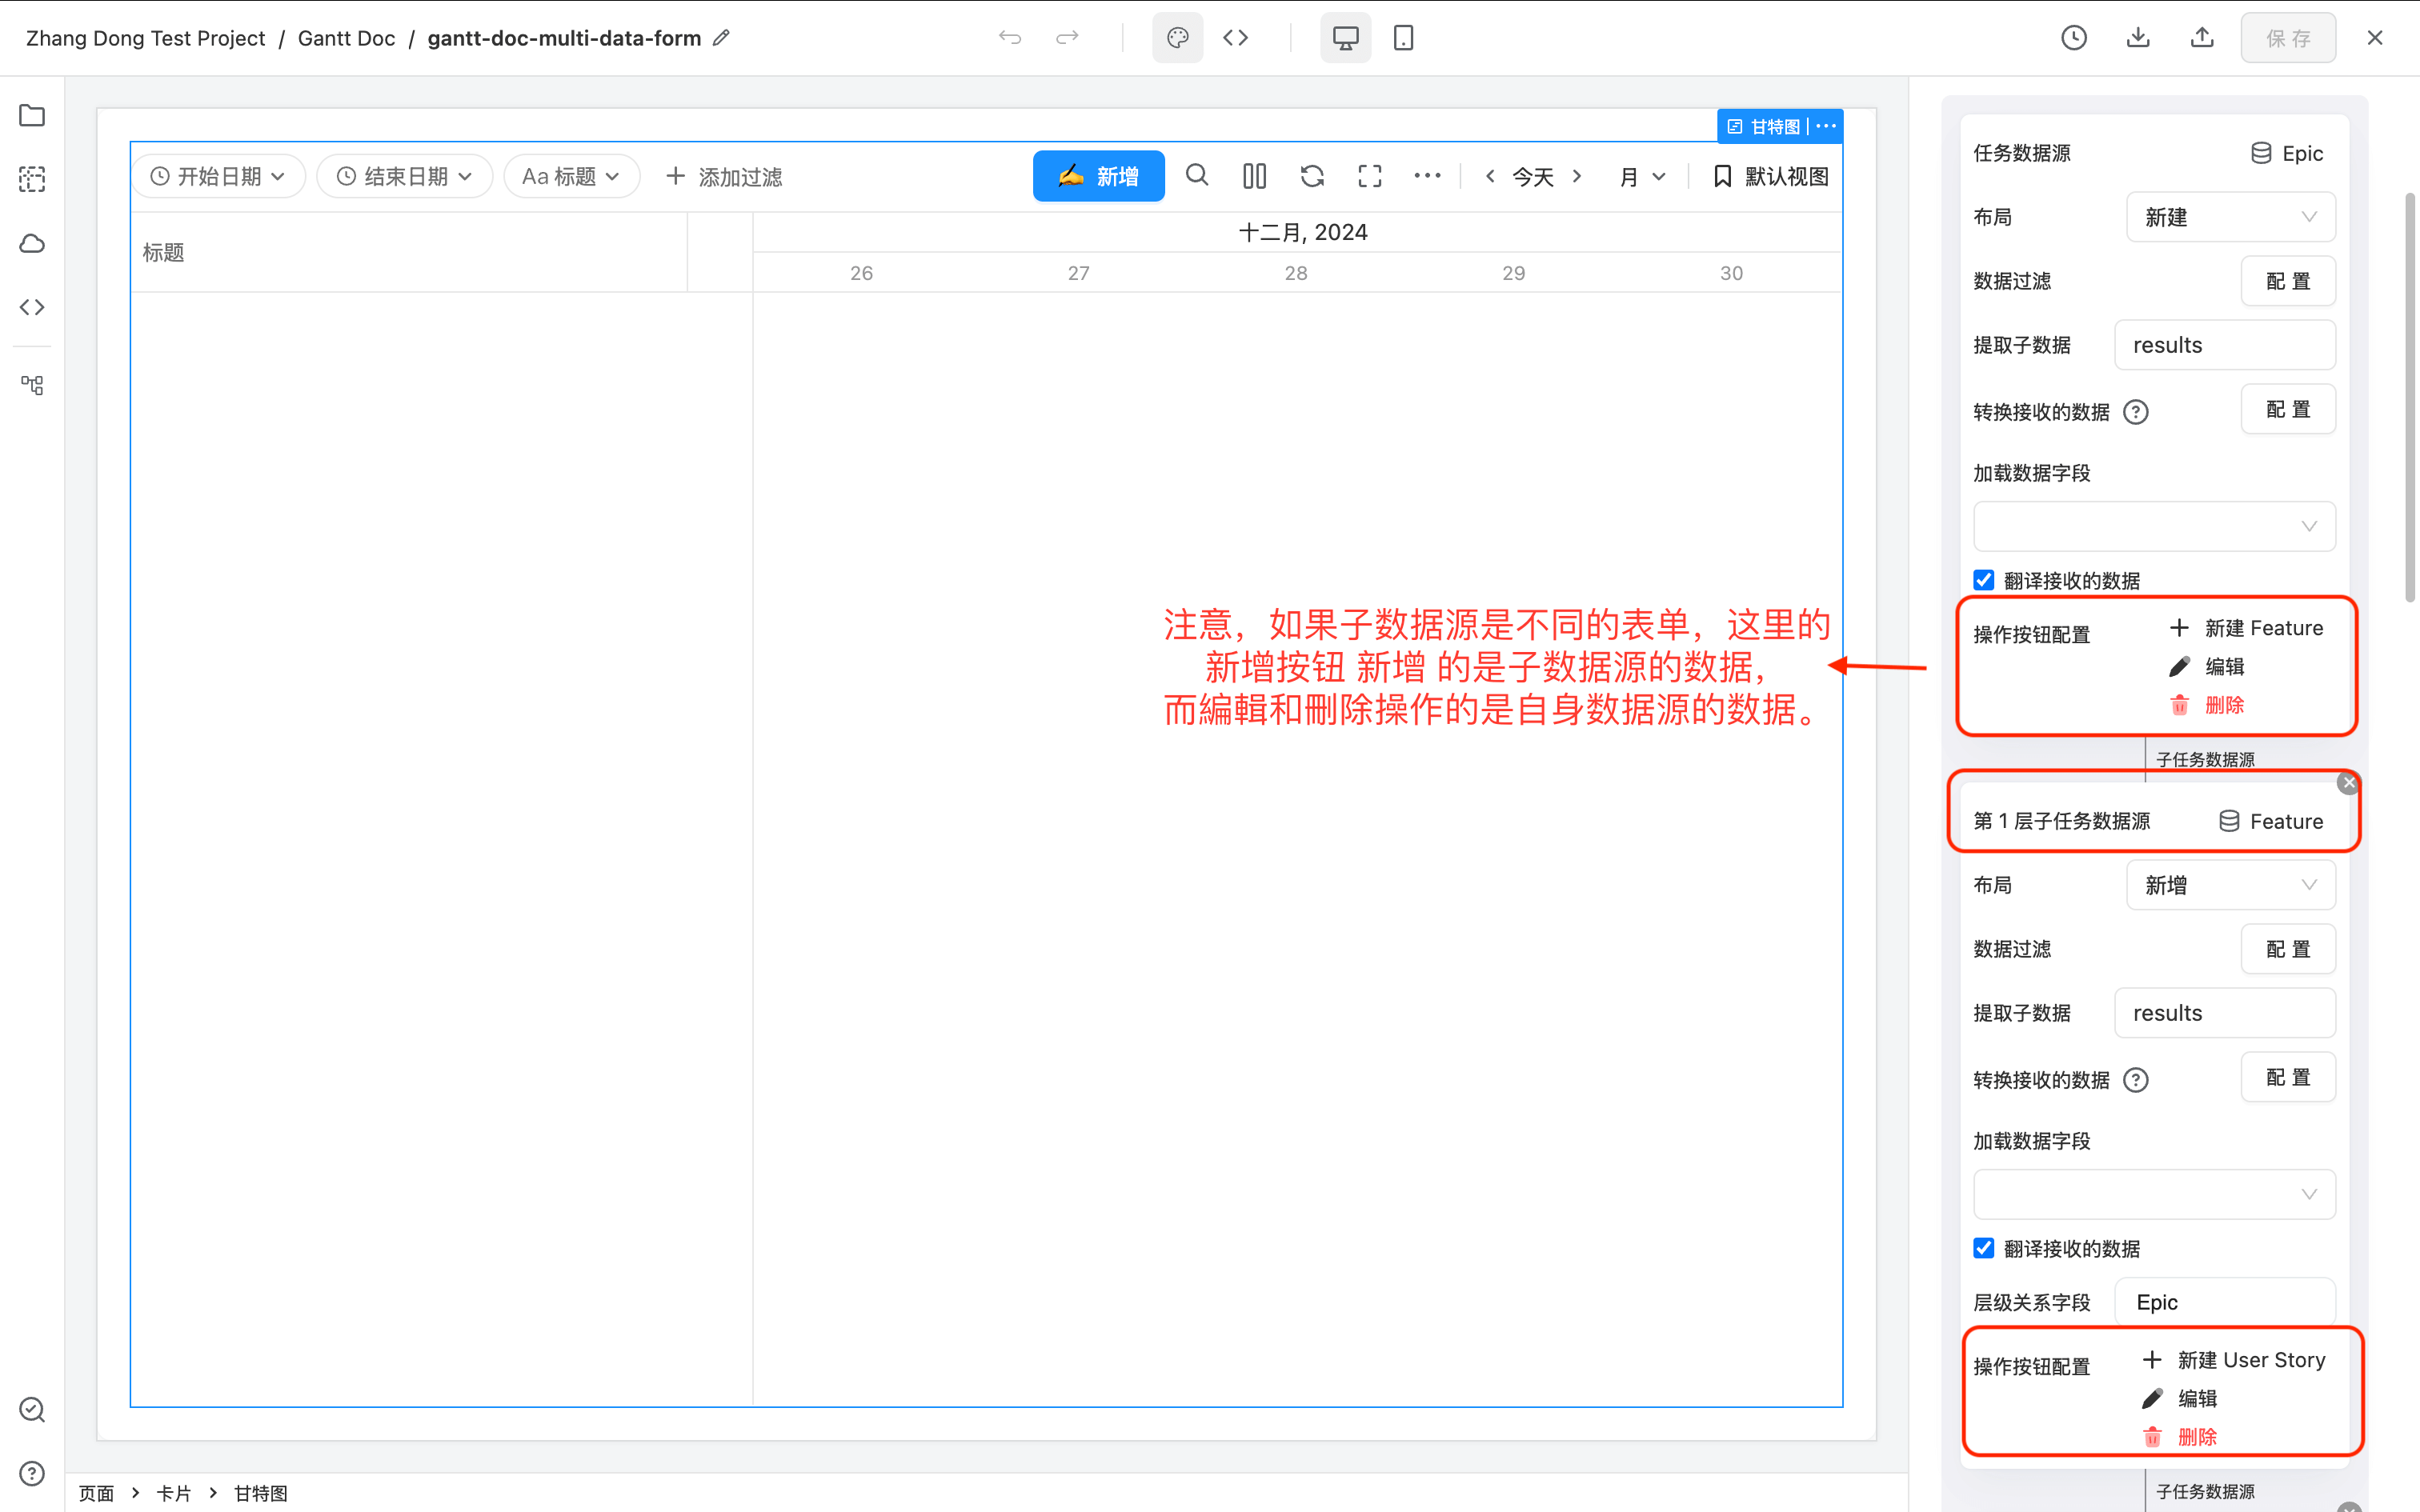
Gantt Graph subtask data source uses different forms
The subtask data sources of the Gantt graph can use different forms separately.
For example:
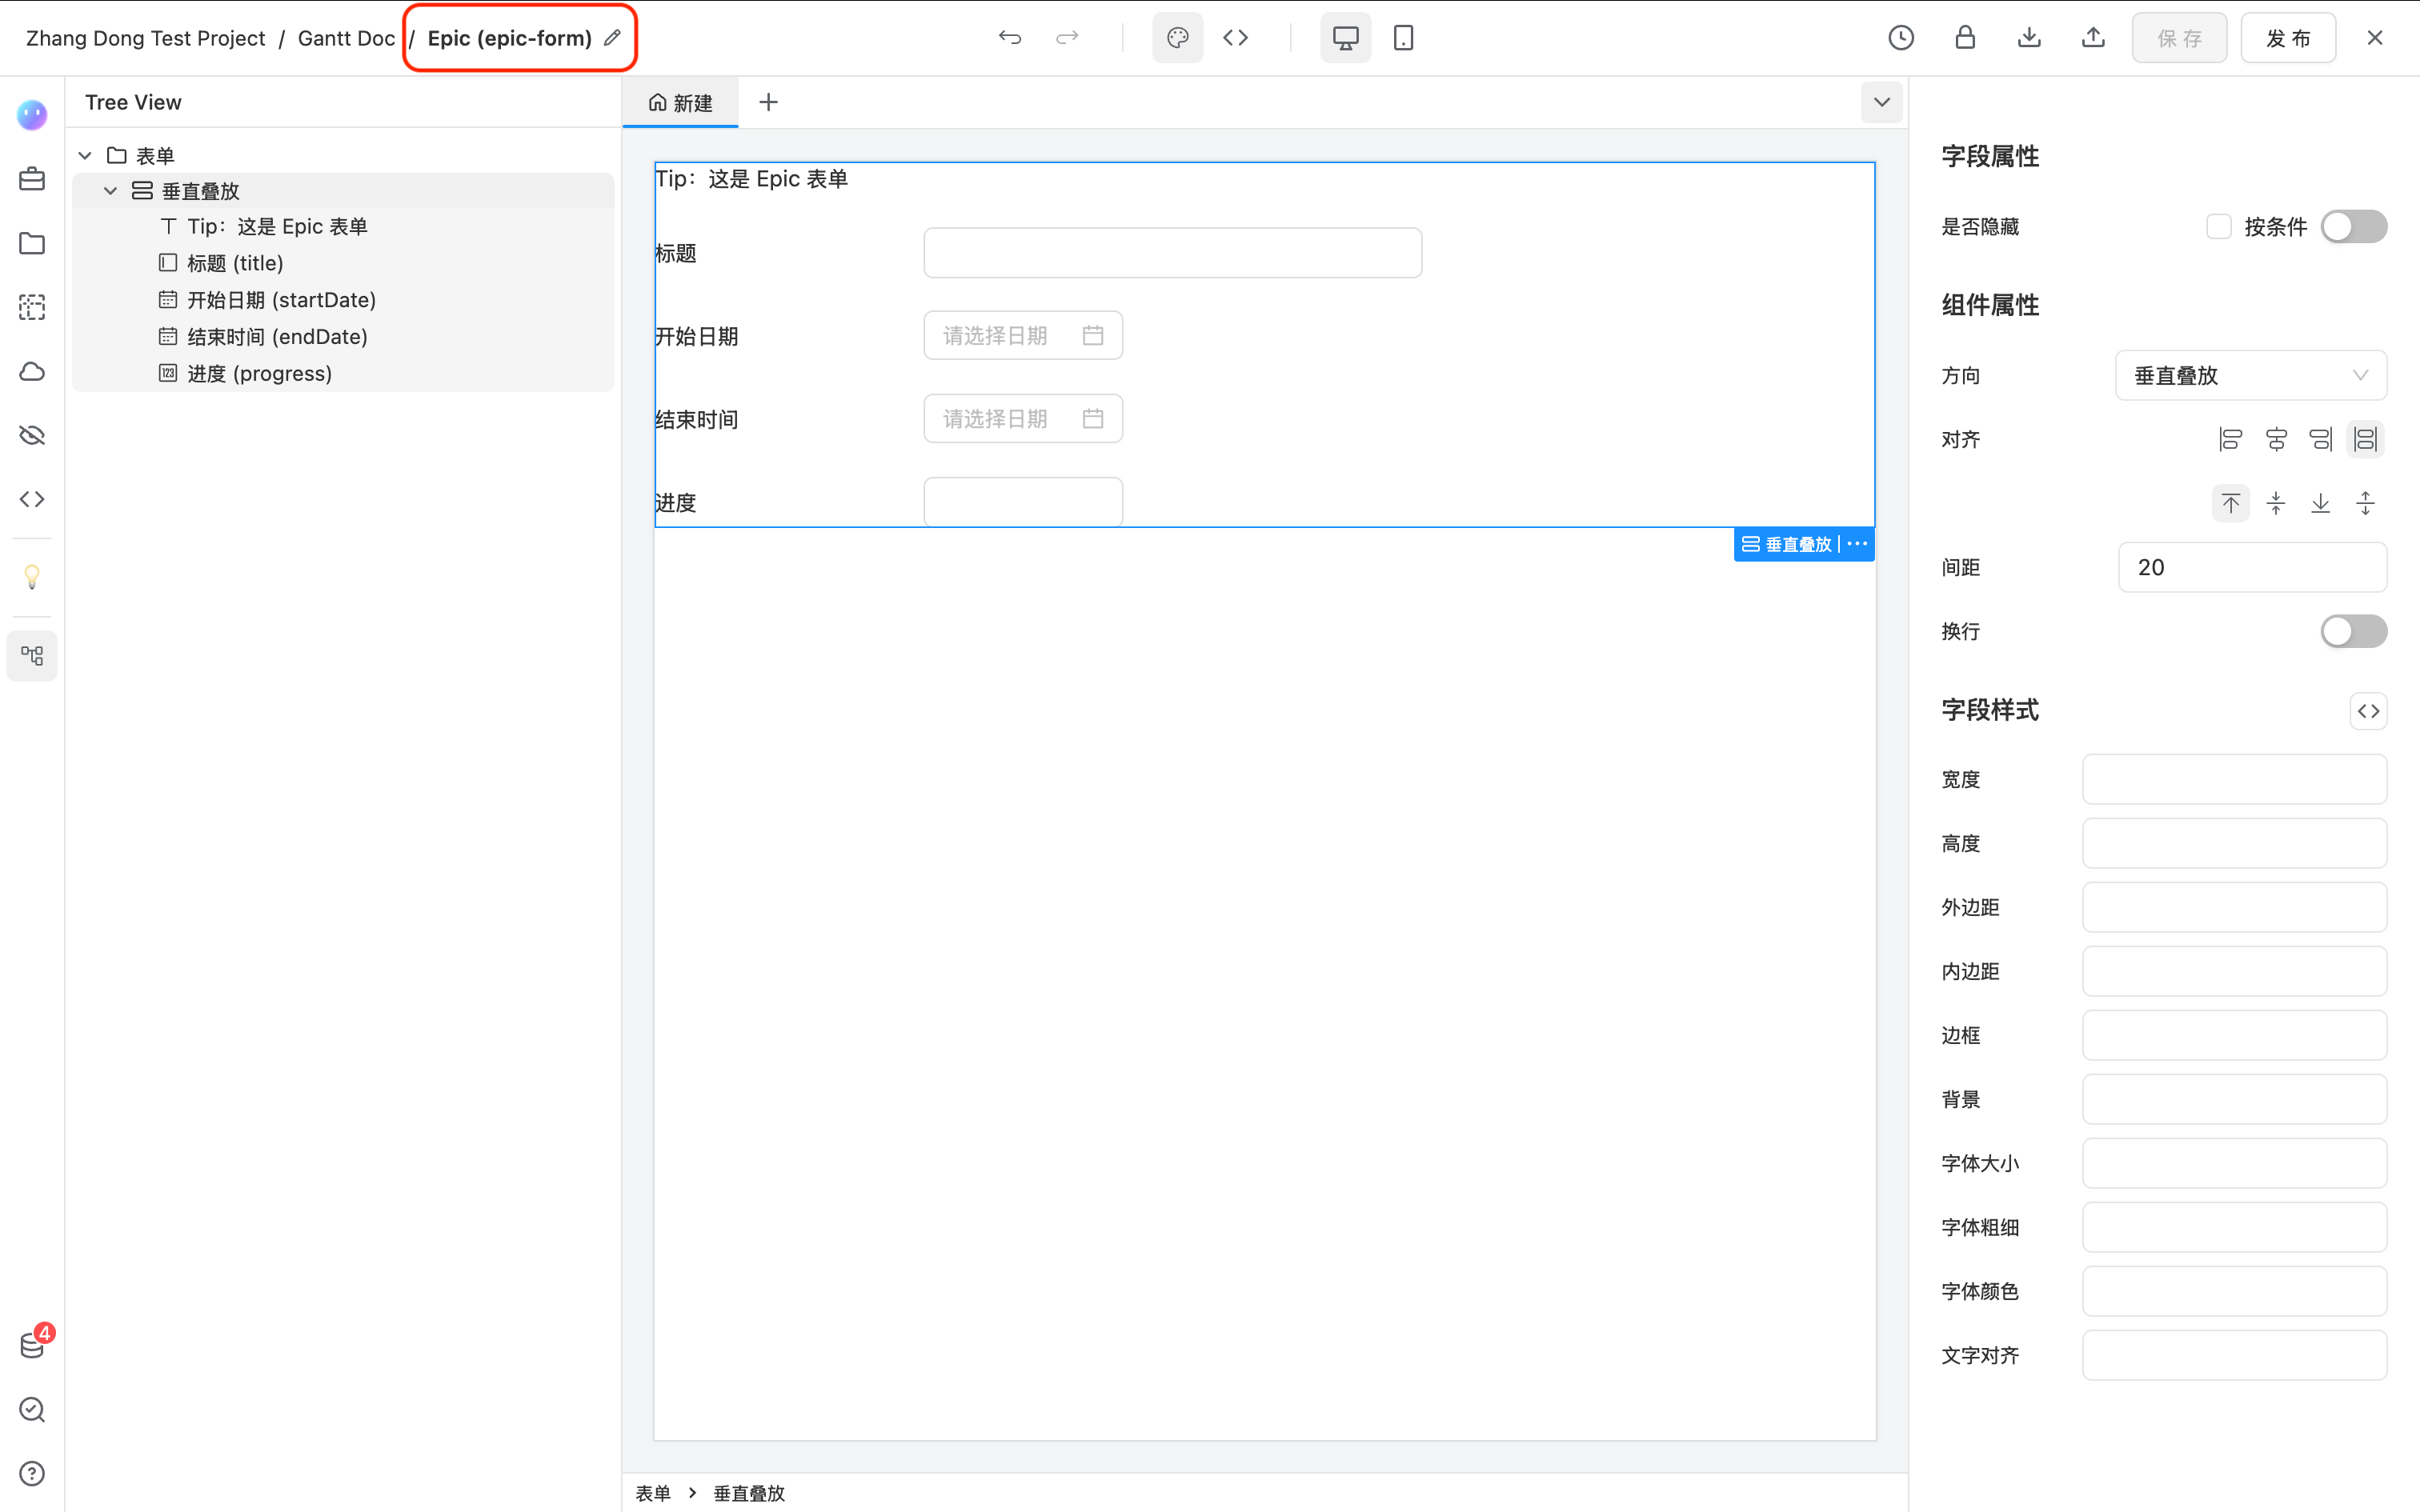
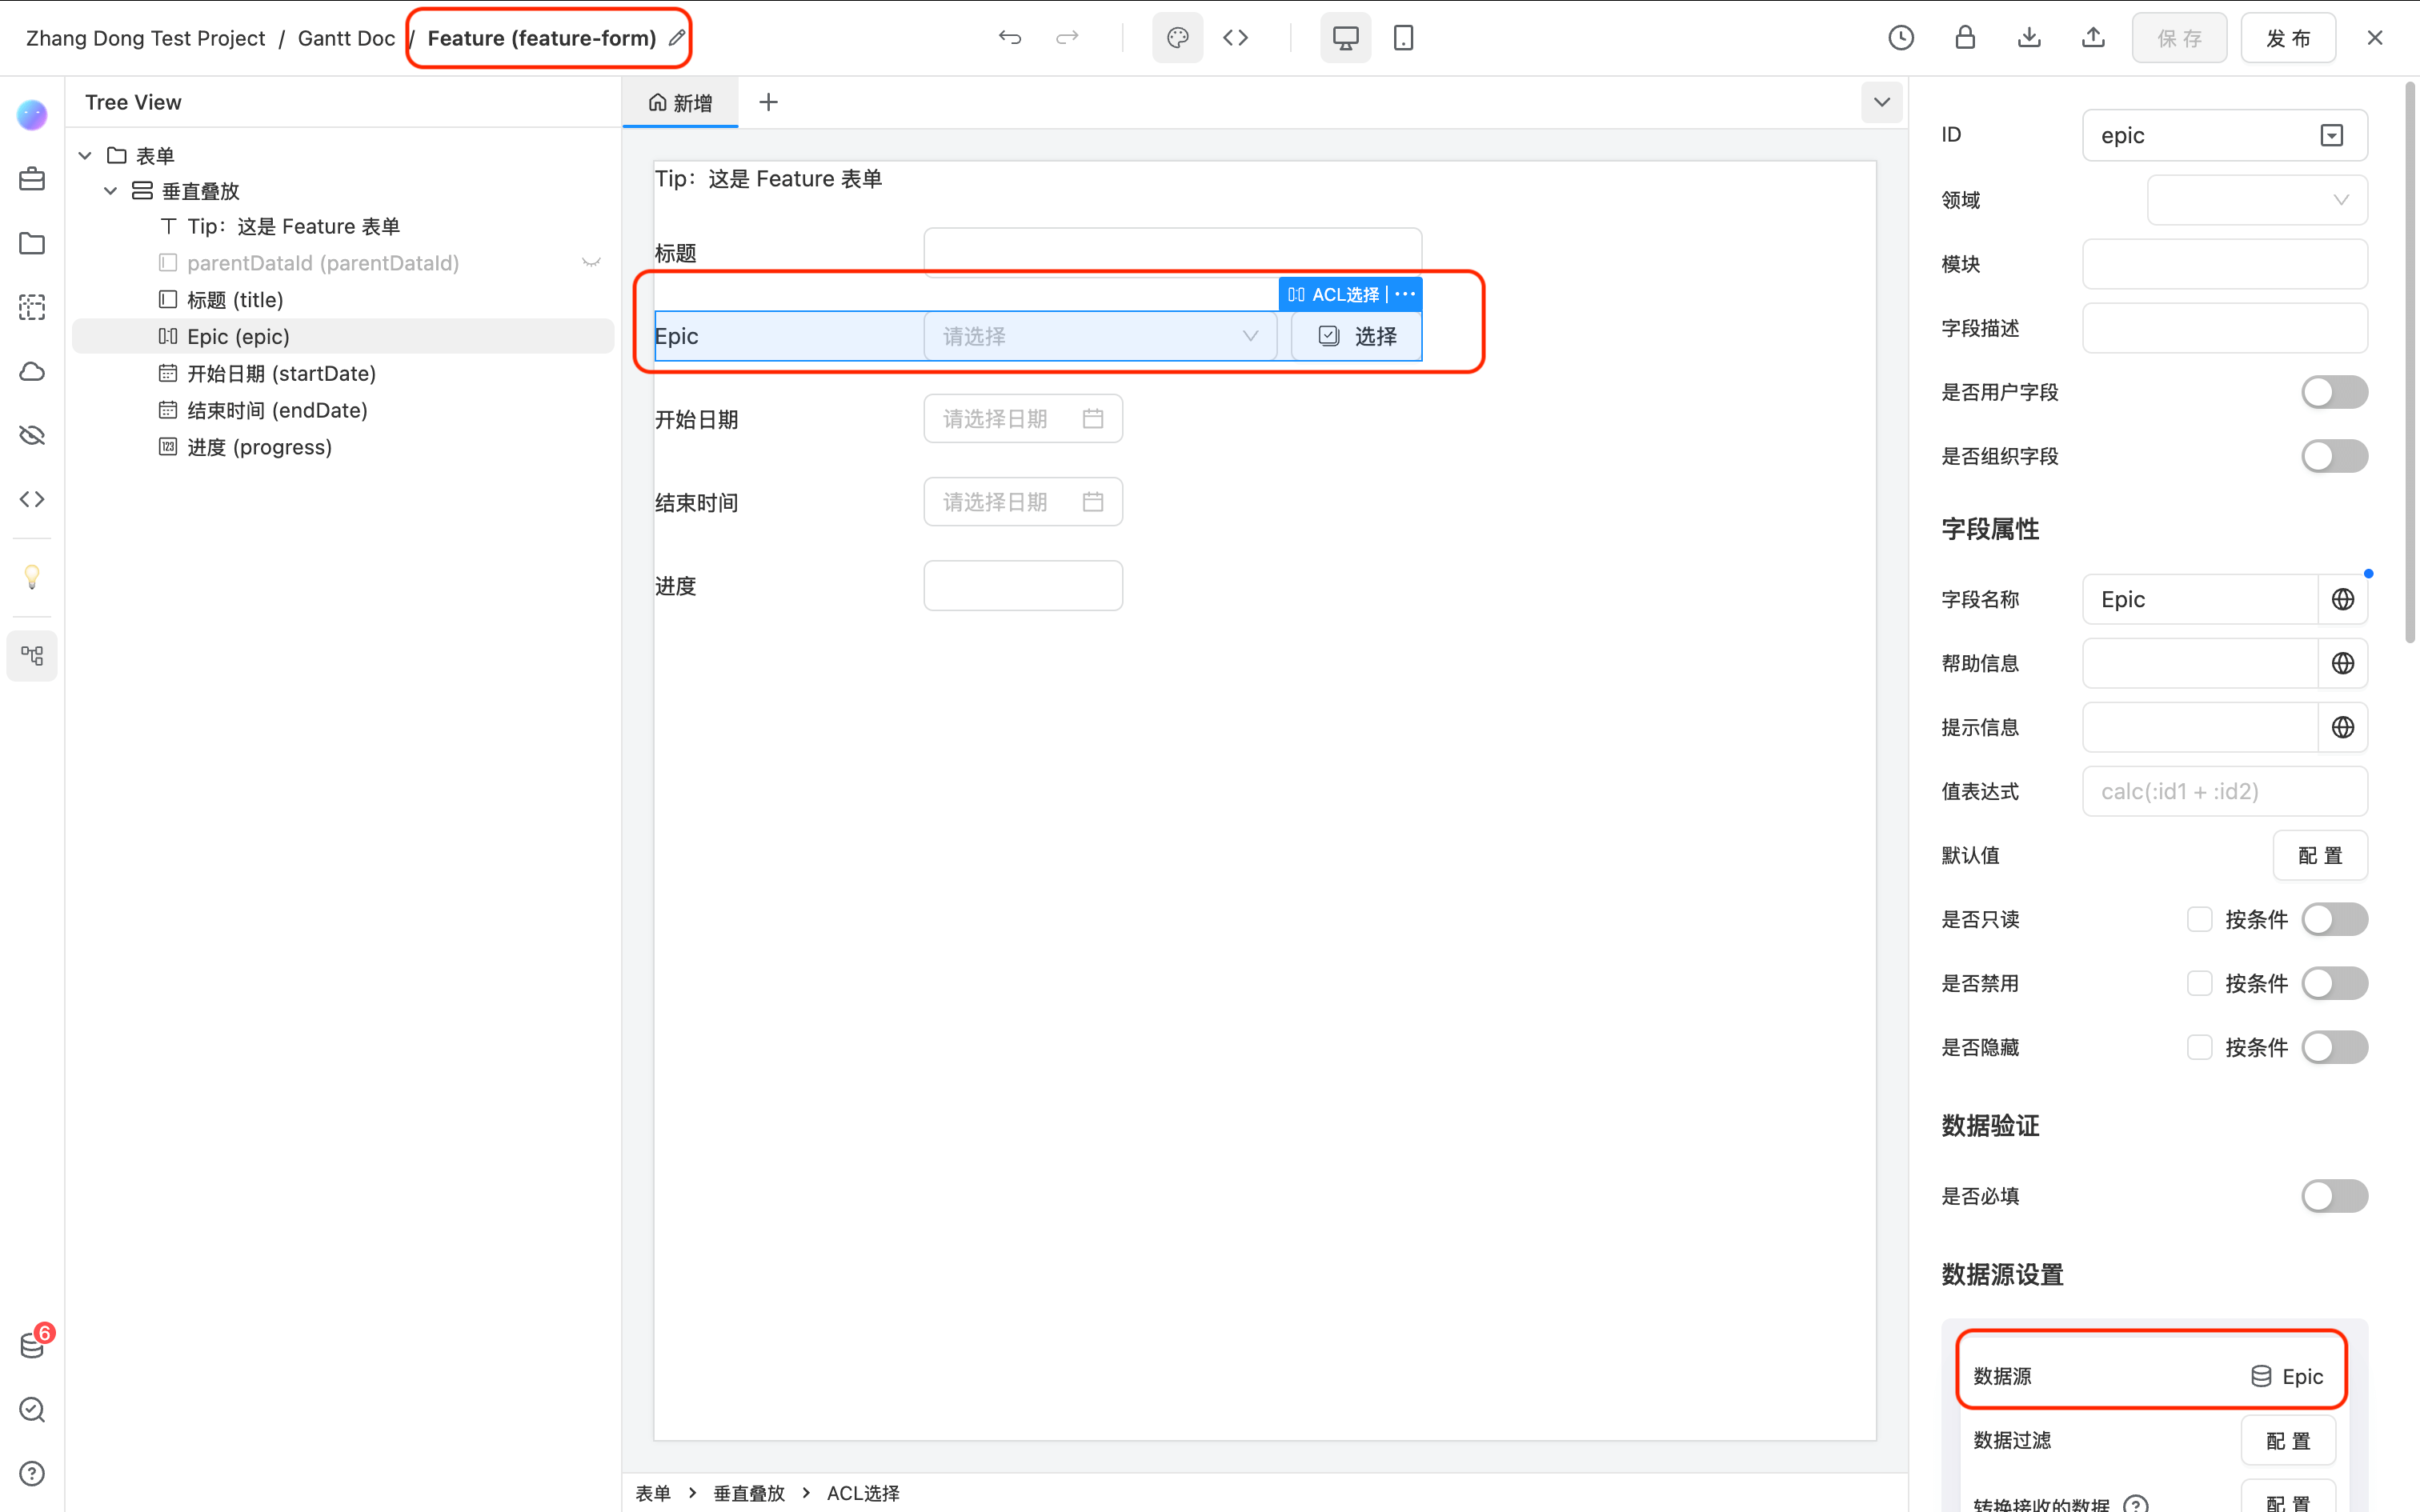
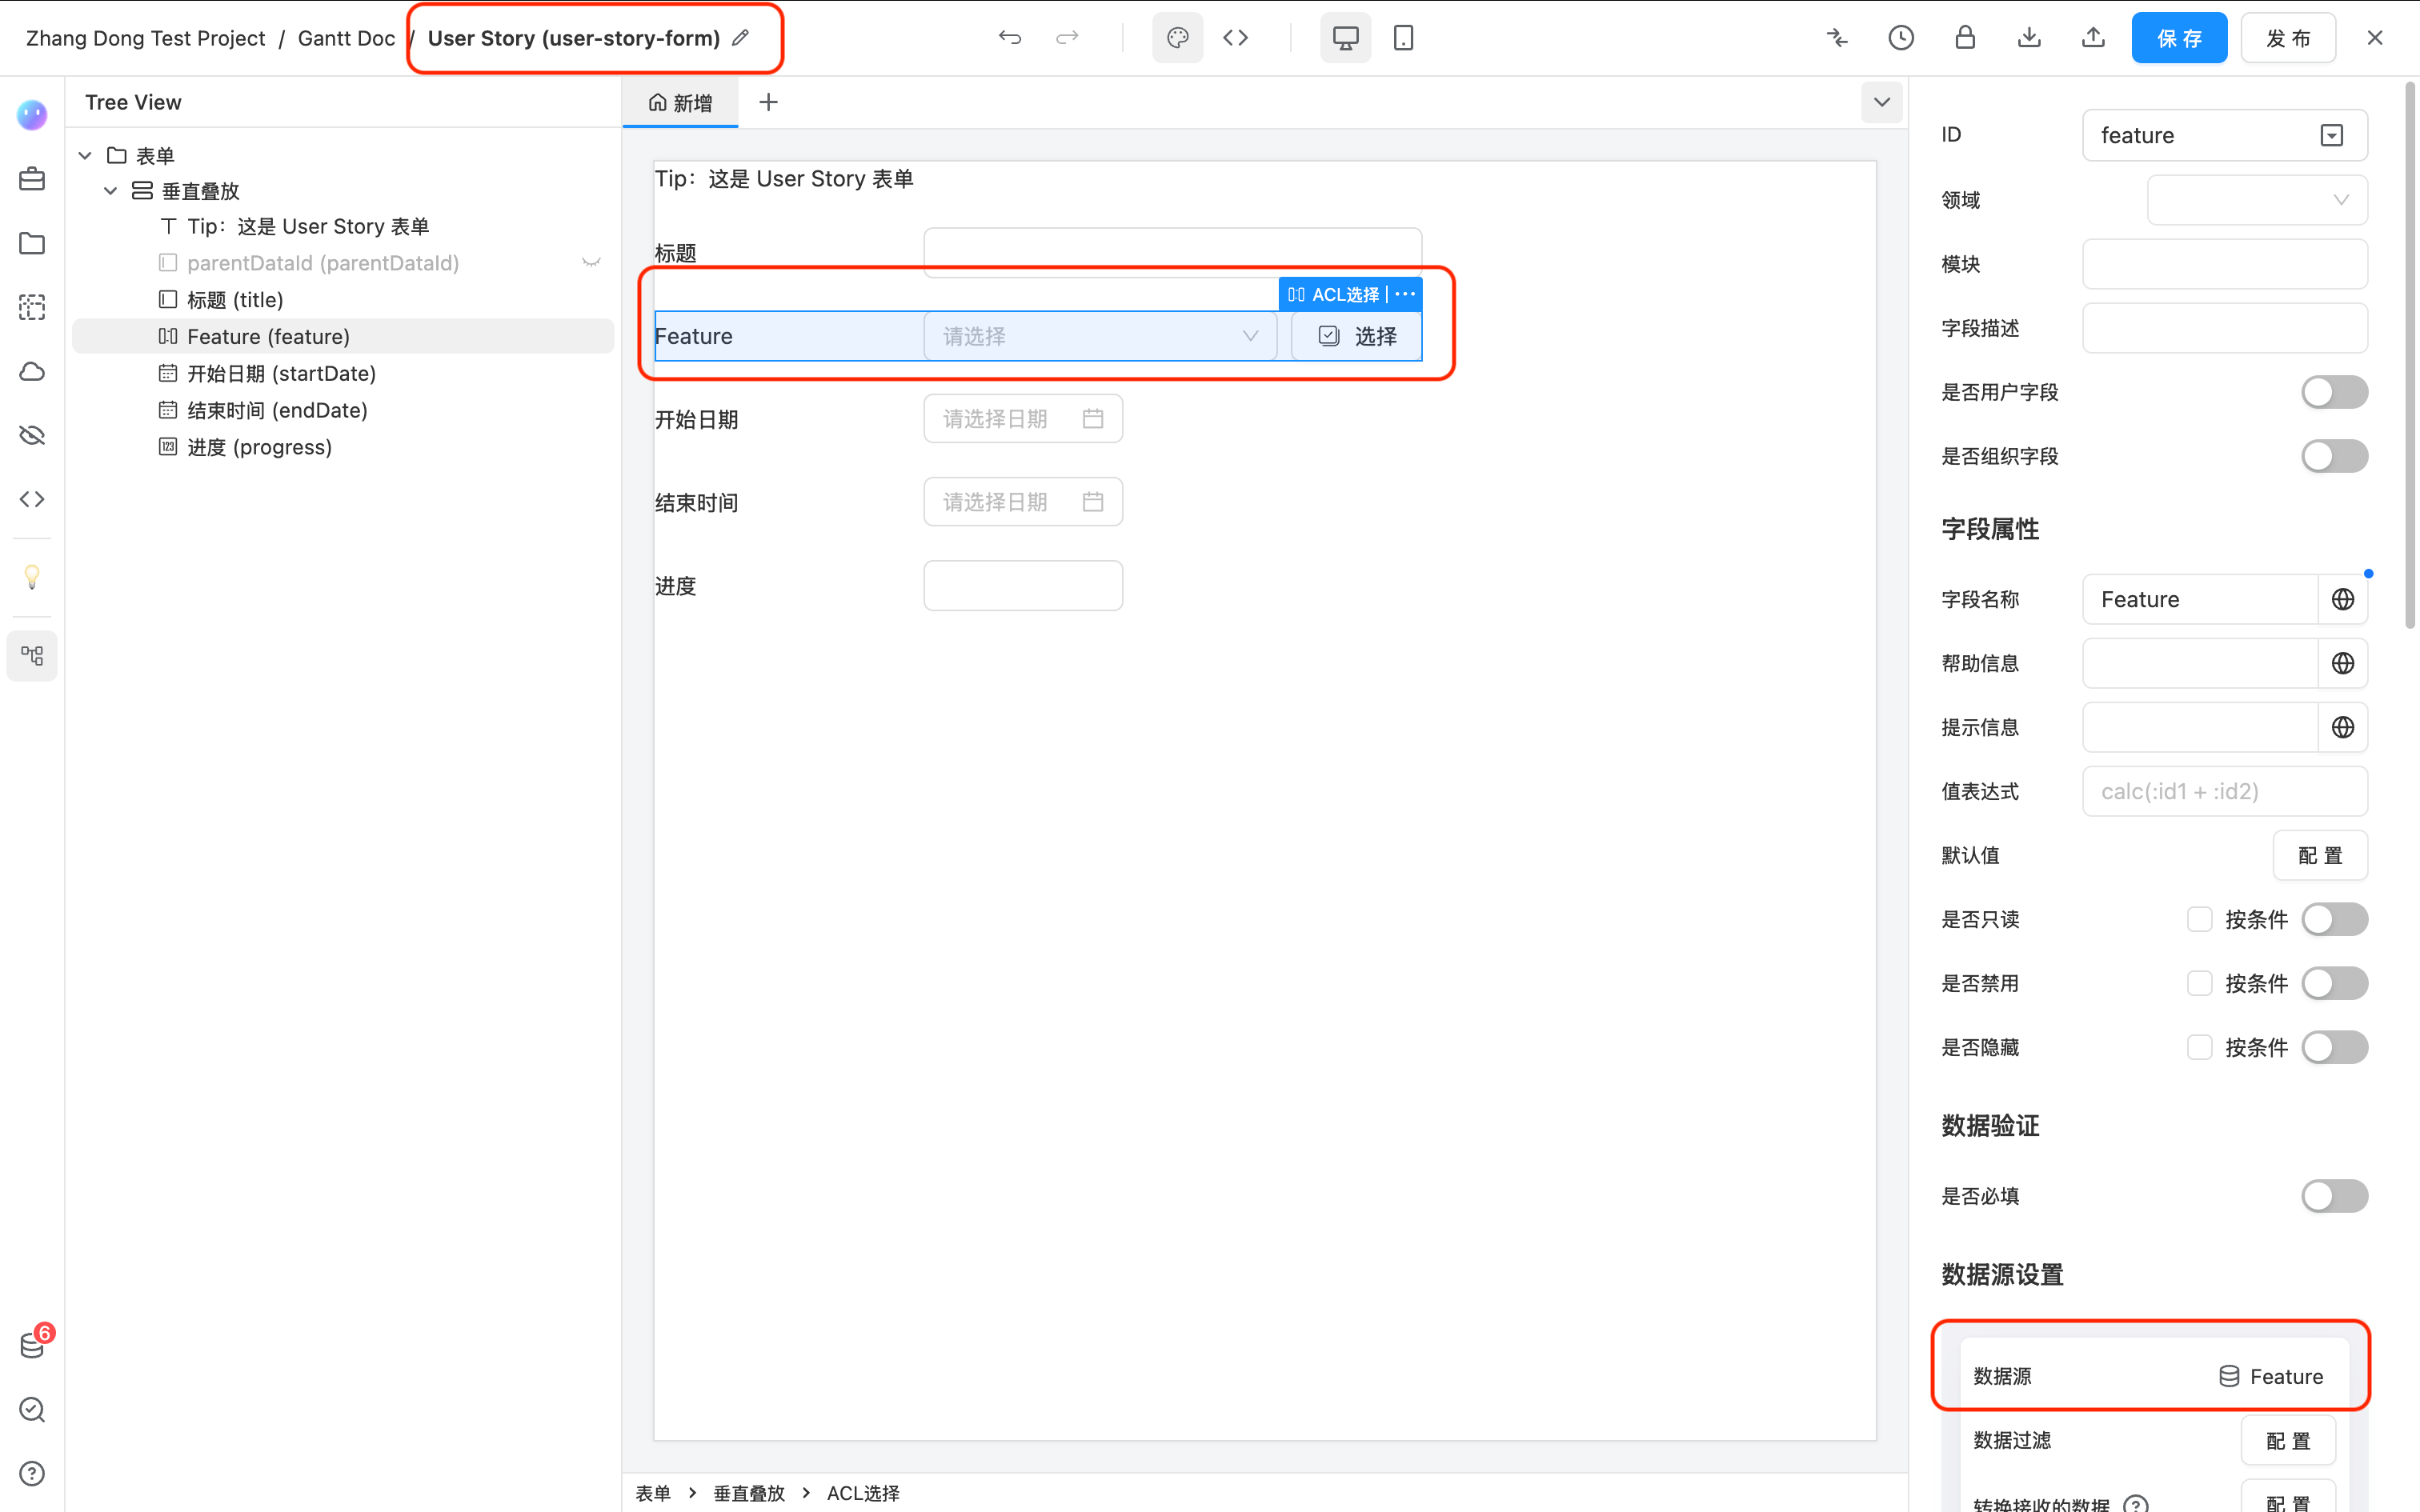
- 3 new forms have been created here. Epic -> Feature -> User Story represents three-layer relationships respectively.
There is an ACL field of Epic in the Feature, and the data source is Epic.
There is an ACL field of Feature in the User Story, and the data source is Feature.
- Create a new page and add a Gantt diagram. In the settings item in the Gantt diagram, select Epic as the task data source, and then click Add subtask data source below, and select Feature as the layer 1 subtask data source. Similarly, User Story is selected as the Layer 2 subtask data source.
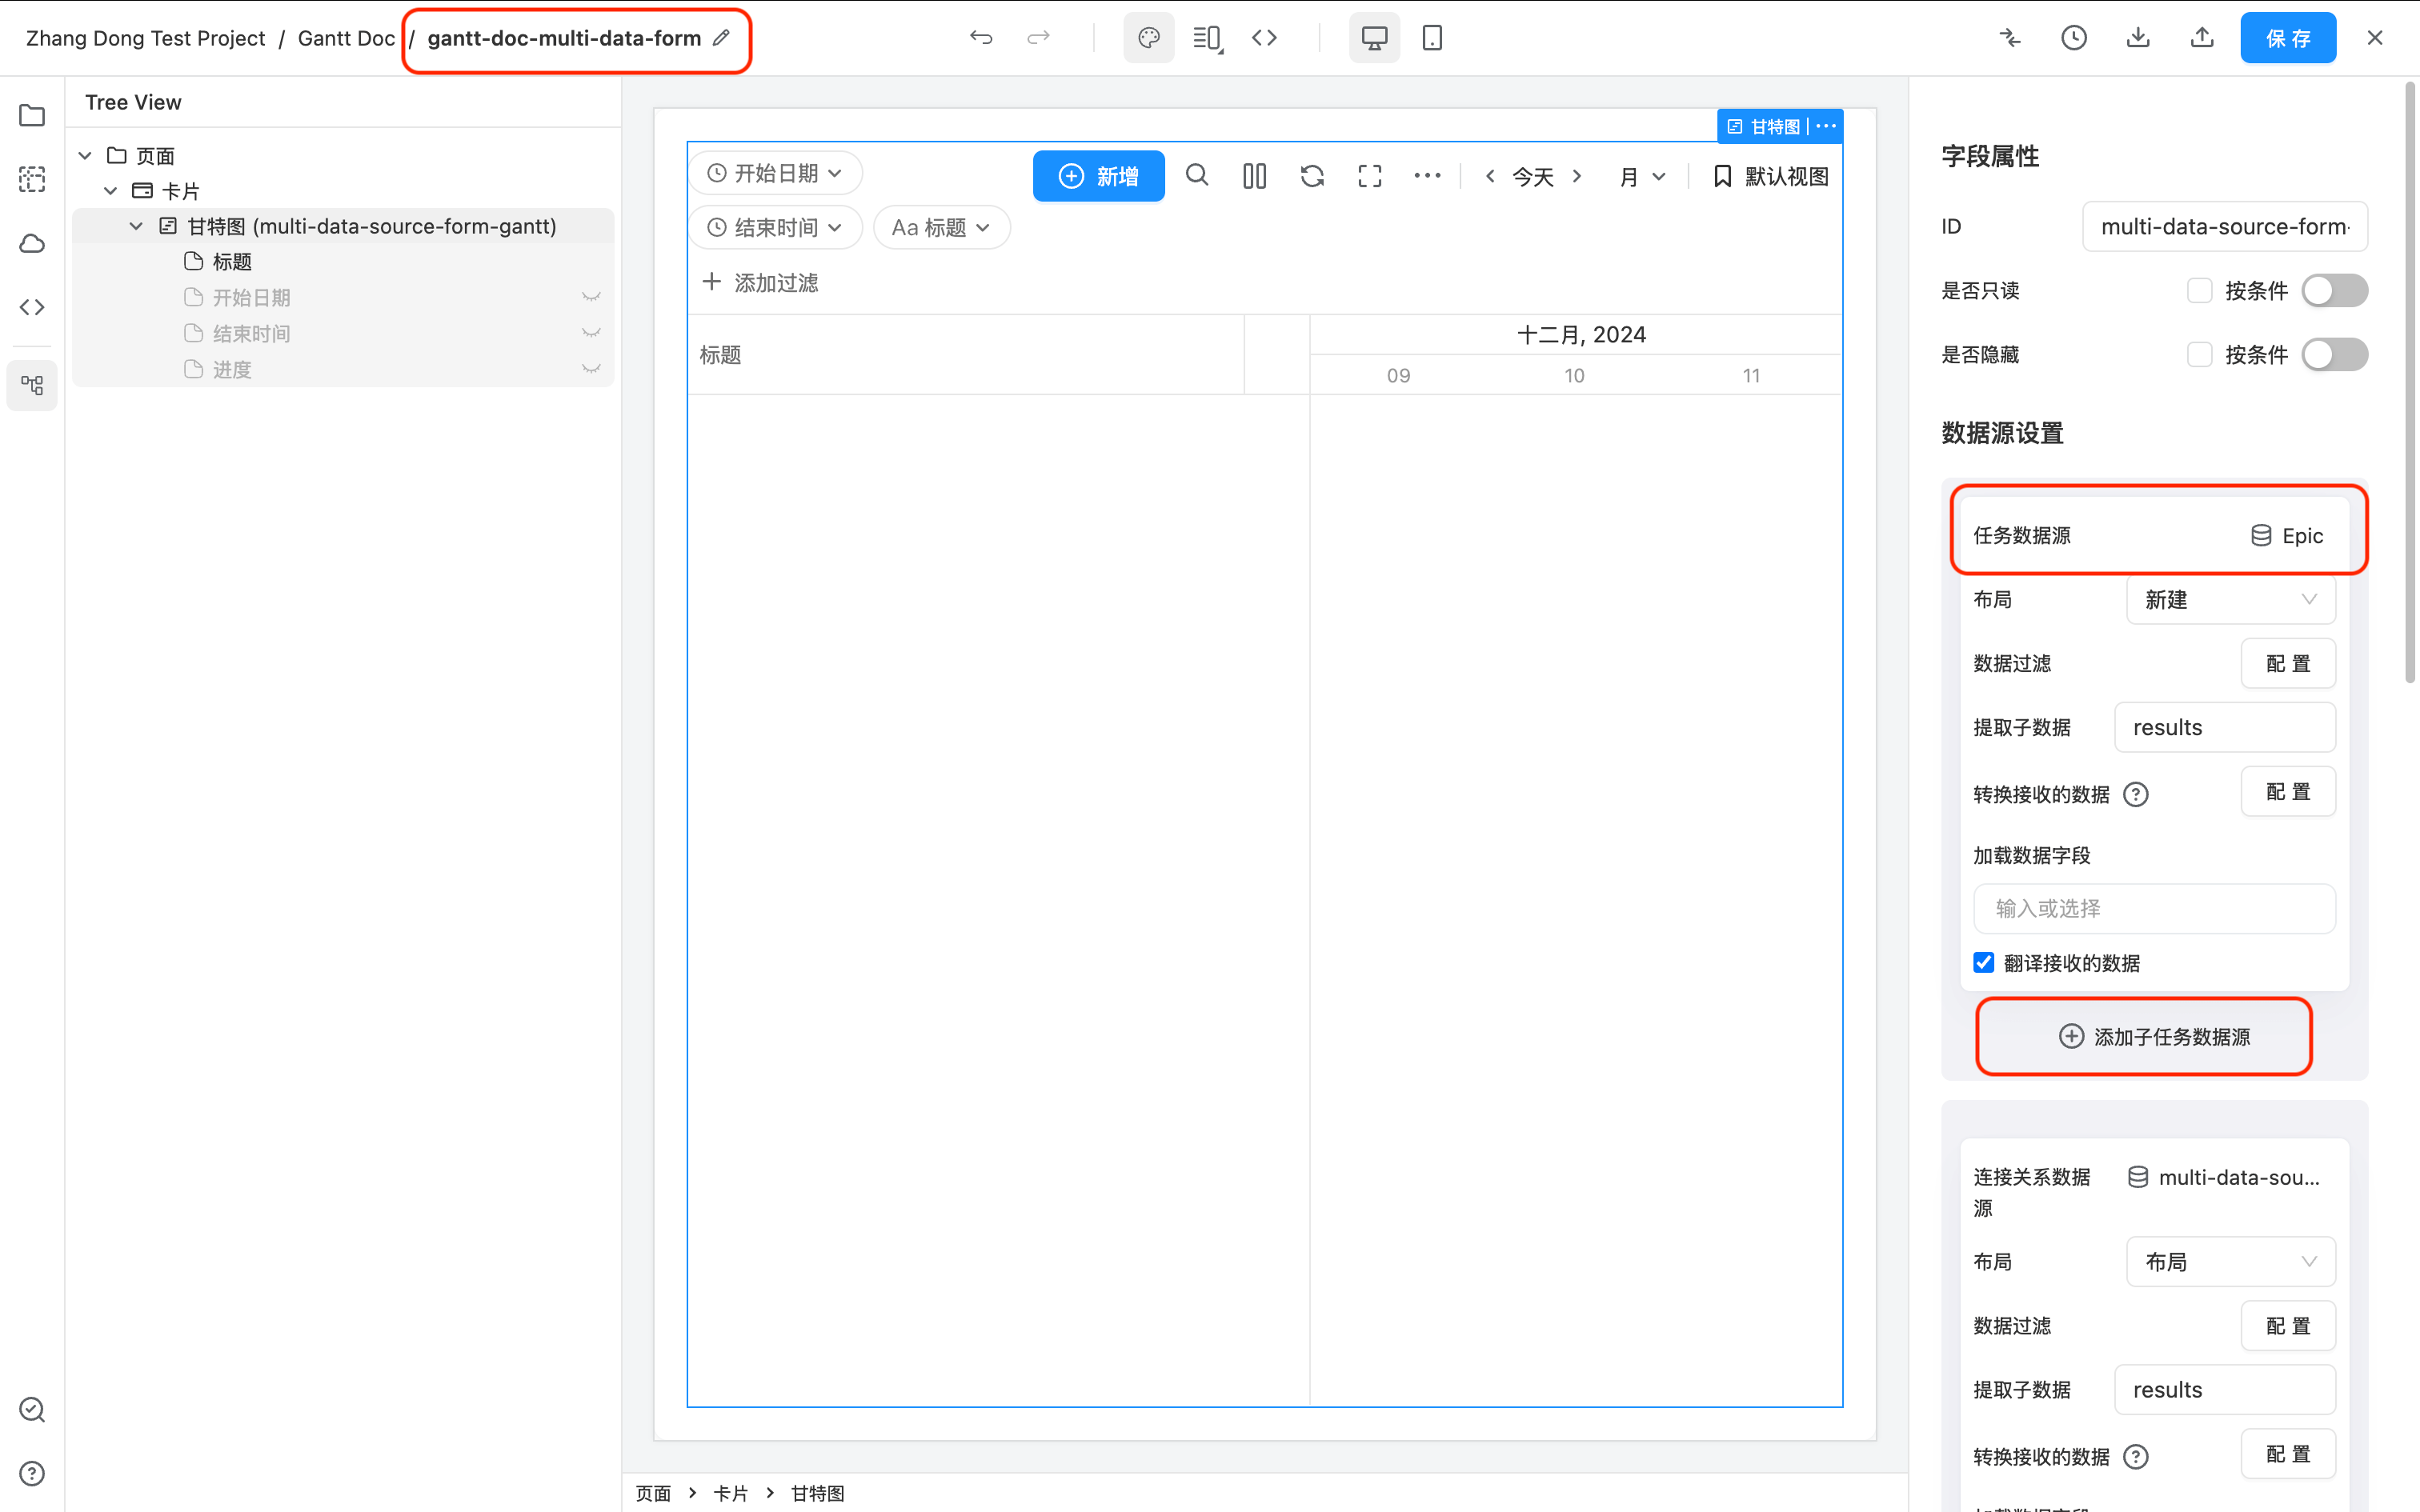
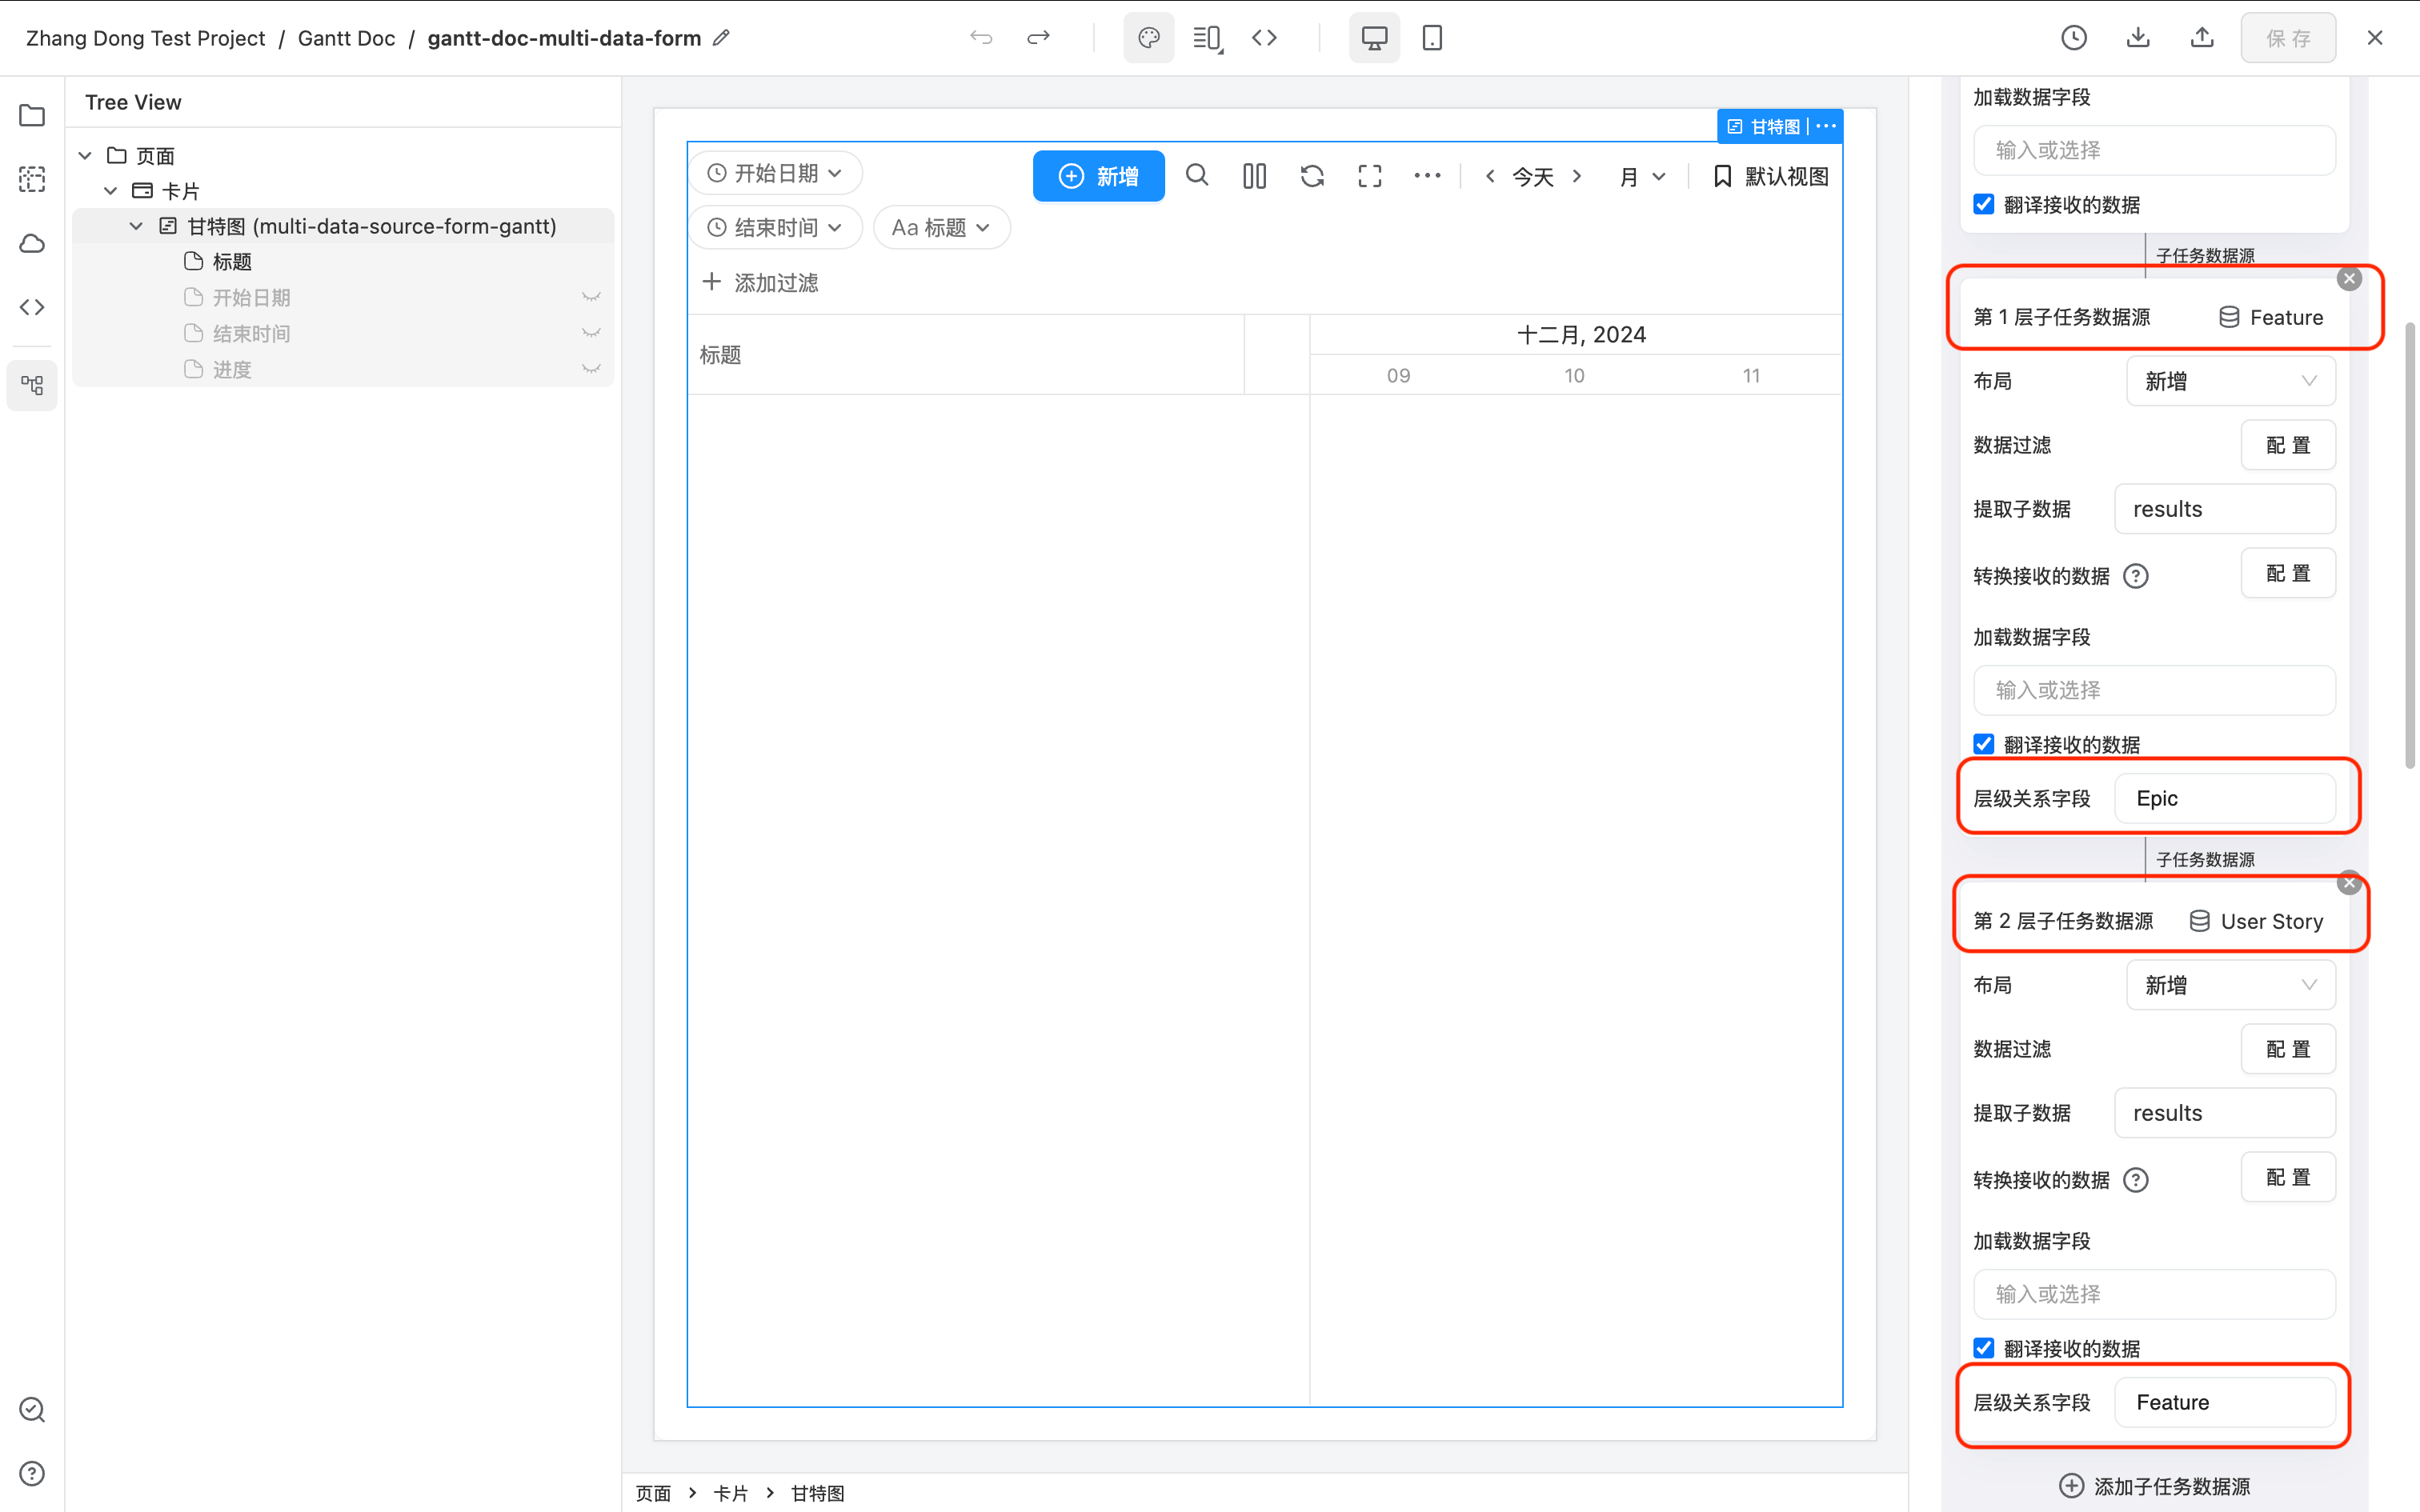
- Make the rest of the settings of the Gantt diagram at the same time. (You can see that there is no Hydraft Relationship Field in the following *Data Map settings, because it now needs to be specified in each layer of subtask data source).
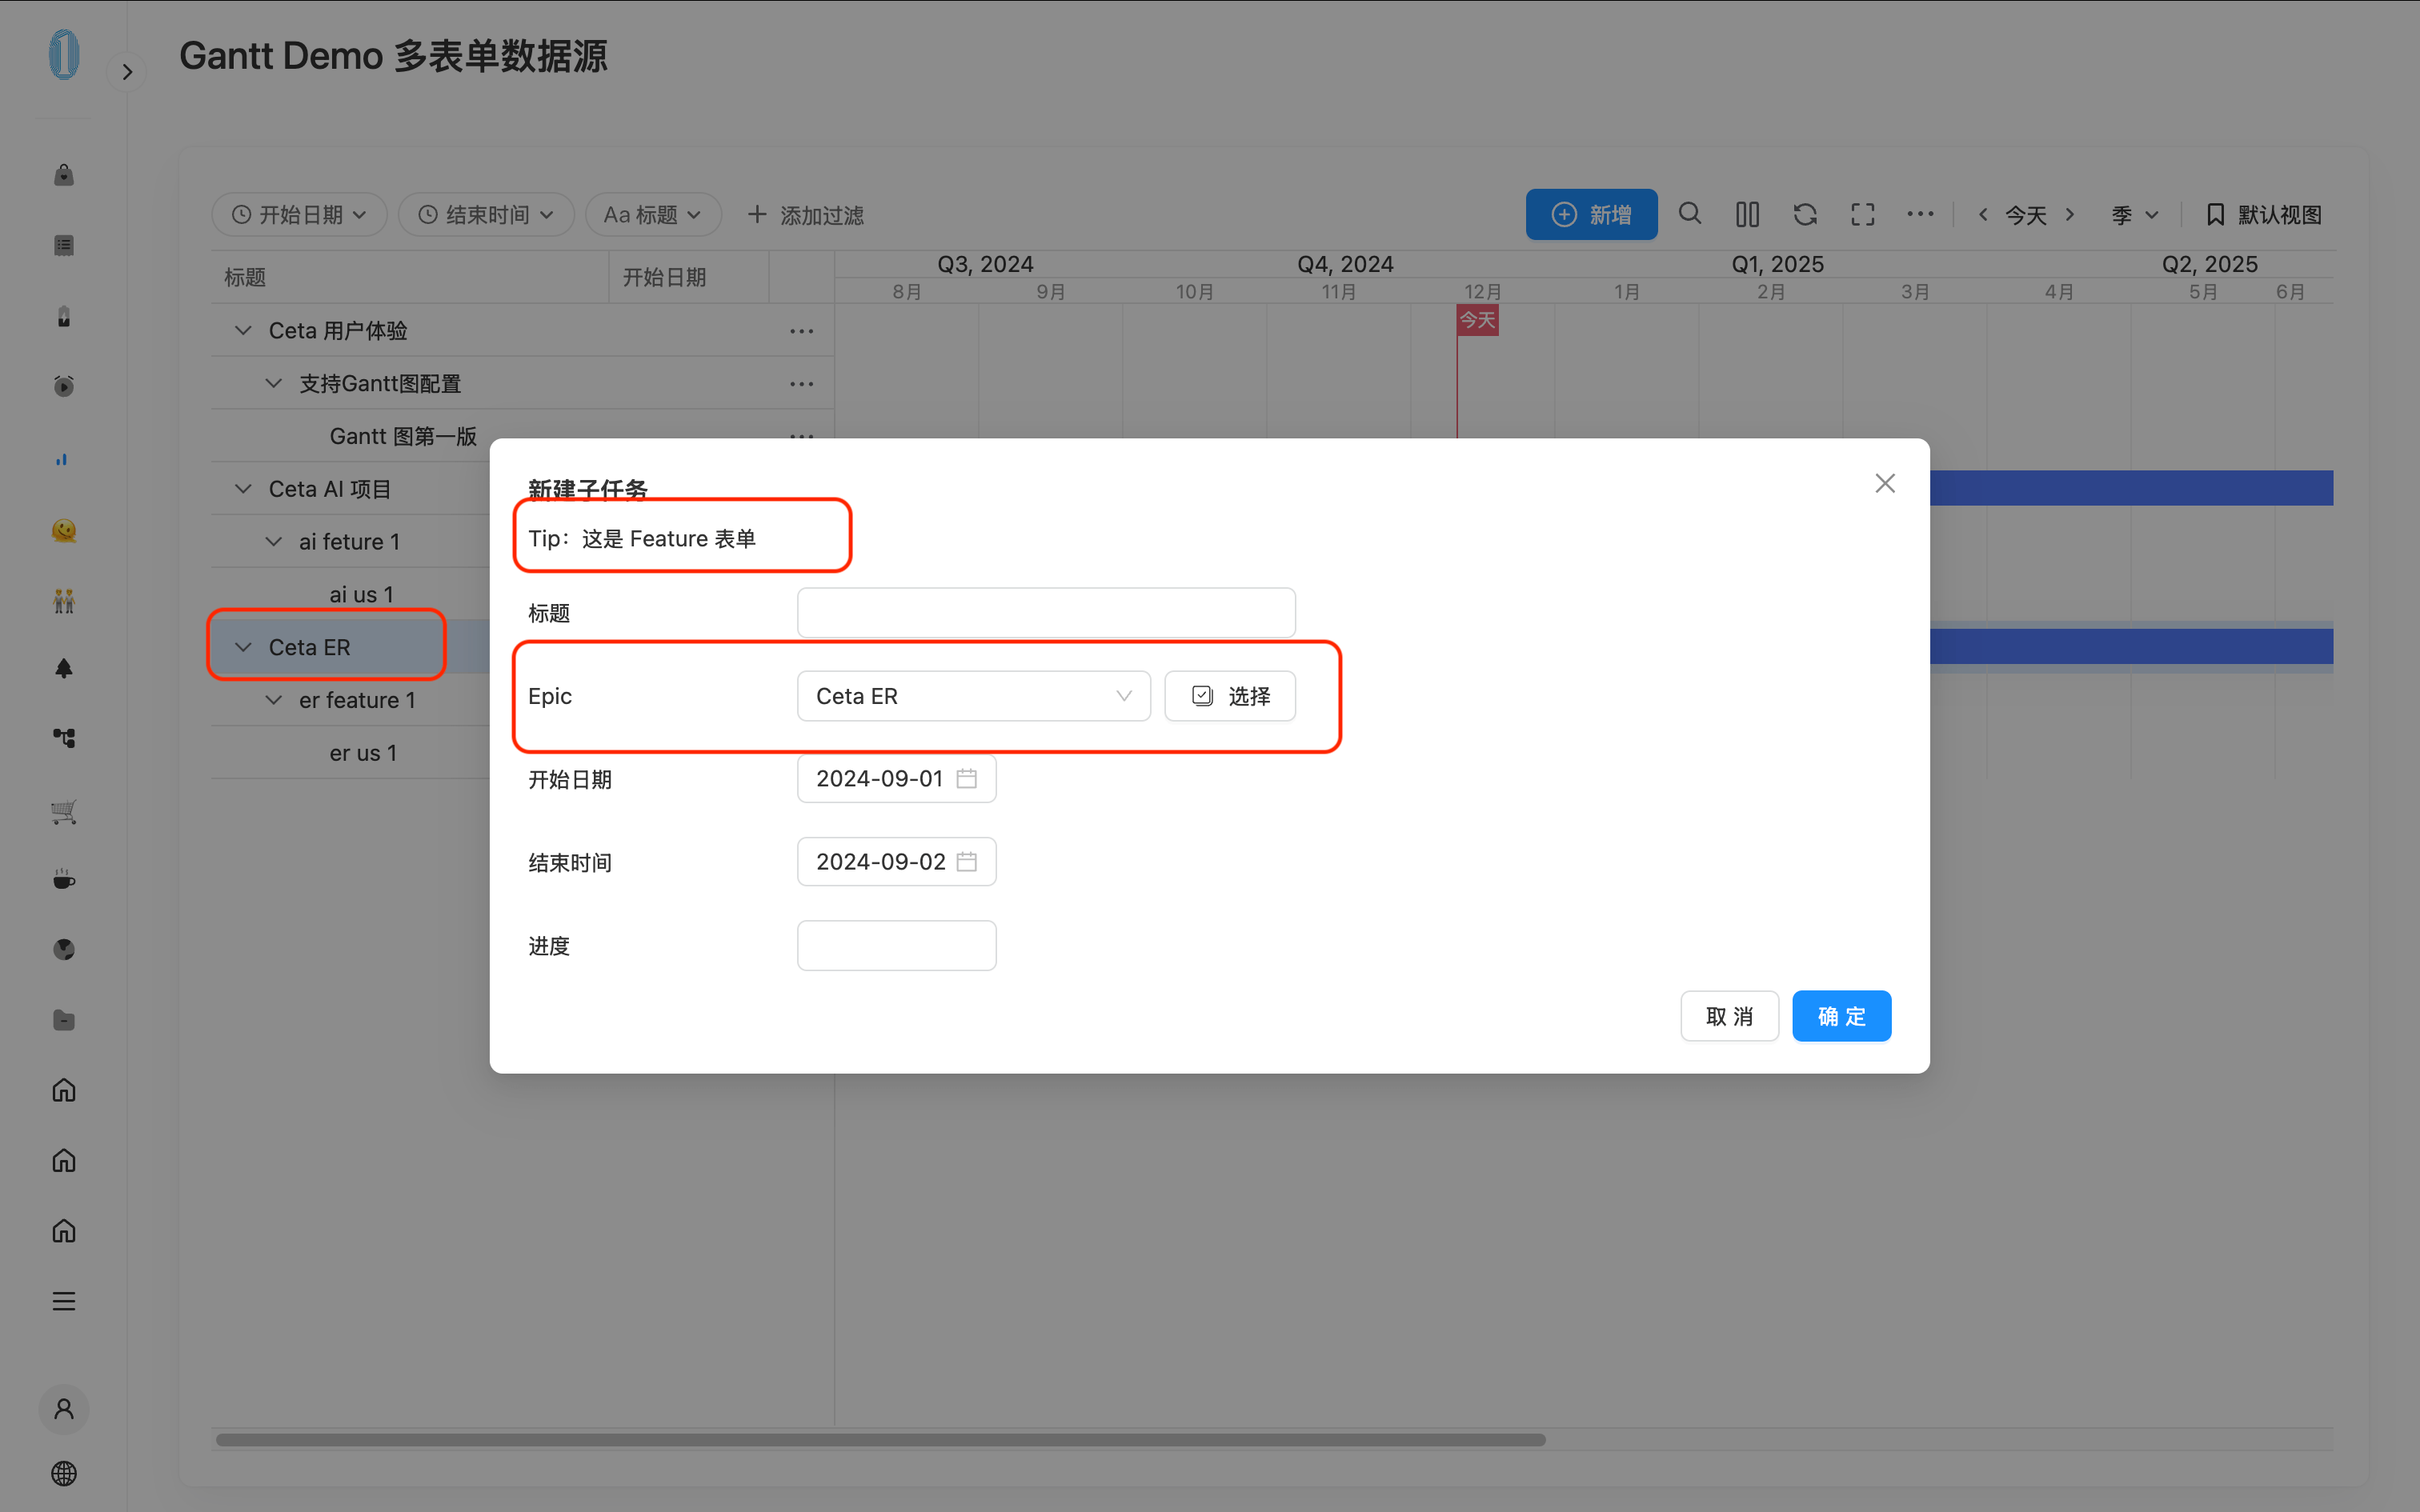
- Now go to the trial run page and click the Toolbar's Add button to add several Epic data. Then click Add subtask on the Epic data and you will see that the form used in Dialog is the Feature form.
API
The complete Gantt API reference is here Gantt